# Amos Graphics Reference Guide (part 1)
*Part of the IBM SPSS Amos online Help, rendered for AI use. See `llms.txt` for the index.*
# Amos Graphics Reference Guide
## Main Window
### Getting help
If you want to know what something is (a button, say, or a box that looks like you are supposed to type something in it), point to the object with the mouse and press the F1 key.
Alternatively, if you see a small "?" button in the upper right-hand corner of the window, press the "?" button and then click the thing that you want explained.
#### Finding out what a toolbox button does
To get a one-line explanation of what a button does, place the mouse pointer over the button. A brief description of its function will appear in the title bar of the Amos window. For further help, press F1.
#### Finding out what a menu item does
To get an explanation of a menu item, point to the menu item with the mouse pointer and press the F1 key.
### Views of the model
**Keyboard navigation:** Use CTRL-SHIFT-R to toggle between Path Diagram view and Syntax view.
#### Path diagram view
*Help context ID: 3406*
**Keyboard navigation:** Use CTRL-SHIFT-R to toggle between Path Diagram view and Syntax view.
The path diagram view allows you to specify a model by drawing its path diagram. After you [fit a model](#t_calculateestimates), you can display parameter estimates on the path diagram by pressing CTRL-F10.
##### Drawing operations
Amos provides many operations for drawing path diagrams and for improving their looks. For example, you can
- Draw an ellipse to represent an unobserved variable
- Move the ellipse from one place to another
- Make an ellipse bigger or smaller, or change its shape.
These are only three examples of drawing and modeling operations; there are about eighty others. Amos provides four different ways to pick the operation you want to perform:
- Using the mouse to press a button in a toolbox
- Using the mouse or the keyboard to select an item from a menu
- Pressing a shortcut key on the keyboard (for some operations)
- Using the second mouse button to select an item from a pop-up menu (for some operations).
These four methods of selecting an operation are described in the following sections.
###### Using the toolbox
*Help context ID: 3410*
You can choose an operation by pressing a button in an Amos toolbox.
To obtain help for an individual button, hold the mouse pointer over the button and press F1.
###### Toolbox
To obtain help for an individual button, hold the mouse pointer over the button and press F1.
When Amos is first installed, the toolbox contains a subset of the available buttons. You can add buttons to the toolbox or remove them. You can also hide the toolbox.
###### Using menus
*Help context ID: 3400*
To initiate an operation, you can choose an item from the Amos menu. Here is what the menu looks like when you indicate that you want to draw an ellipse:
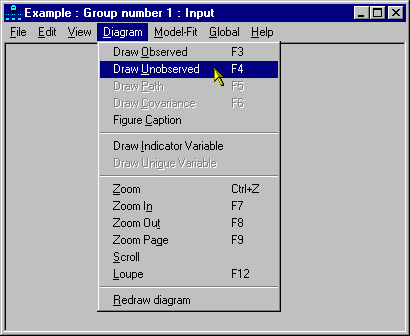
Menu items can also be selected from the keyboard. Instead of using the mouse to select **Draw Unobserved** from the **Diagram** menu, you could instead hold down the ALT key and press the D key followed by the U key.
[mf]
###### Using keyboard shortcuts
Keyboard shortcuts are provided for a few common operations. For example, you can indicate that you want to draw an ellipse by pressing the key. When a shortcut key is available for an operation, the shortcut key is shown on the menu.
###### Using pop-up menus
Once you have drawn a path diagram, or drawn it partially at least, you can use one additional method of choosing further operations on the path diagram. You can move the mouse pointer over any object in the path diagram (that is, any rectangle, ellipse, arrow or caption), and click the second mouse button. Then Amos will display a menu of operations that can be performed on that object. For example, using the second mouse button to click on an ellipse pops up a menu of things that you can do to ellipses.
#### Tables view
Amos provides two views of a model. The *Path Diagram* view displays a model graphically. The *Tables* view displays a model in three tables. The following figures show both views of the model of Example 4 in the User's Guide.
|  |
| --- |
| Path Diagram View |
|  |
| --- |
| Tables View |
The Tables view contains three tables. The Variables table has a row for each variable in the model. The Regression Weights table has a row for each regression weight. The Covariances table has a row for each covariance. Each table has an empty row that you can use to add new items. For example, use the empty row at the bottom of the Regression Weights table to add a new regression weight.
A variable must be entered in the Variables table before it can be referred to in the Regression Weights table or the Covariances table.
Click any column header to sort the rows of a table. For example, click the Name column in the Variables table to sort the variables alphabetically by name.
To switch back and forth between the Path diagram view and the Tables view, do one of the following.
1. Choose **View****®****Switch to other view** from the Amos Graphics menu.
2. Enter the shortcut key combination CTRL+SHIFT+R.
3. Click the *Path Diagram* or *Tables* tabs near the bottom of the Amos Graphics window.

The Tables view is not displayed when using the [modeling lab](#t_runtheamosmodelinglaboratory) and when performing a specification search.
##### Variables Table
The Variables table has a row for each variable in the model. You can use the empty row at the bottom of the table to add a new variable.
A variable must be entered in the Variables table before it can be referred to in the Regression Weights table or the Covariances table.
Click any column header to sort the rows of the table. For example, click **Name** to sort the variables alphabetically by name.
##### Regression Weights Table
The **Regression Weights** table has a row for each regression weight in the model. You can use the empty row at the bottom of the Regression Weights table to add a new regression weight to the model.
A variable must be entered in the [Variables table](#t_variablestable1) before it can be referred to in the Regression Weights table.
Click any column header to sort the rows of the table. For example, click **Dependent** to sort the regression weights alphabetically according to the name of the dependent variable.
##### Covariances Table
The **Covariances** table has a row for each covariance in the model. You can use the empty row at the bottom of the Covariances table to add a new covariance to the model.
A variable must be entered in the [Variables table](#t_variablestable1) before it can be referred to in the Covariances table.
Click any column header to sort the rows of the table. For example, click **Variable 1** to sort the regression weights alphabetically according to the name Variable 1.
#### Syntax view
**Keyboard navigation:** Use CTRL-SHIFT-R to toggle between Path Diagram view and Syntax view.
The syntax view allows you to specify a model by entering and editing a text description of the model. After you [fit a model](#t_calculateestimates), you can display parameter estimates in the syntax view by pressing CTRL-F10.
##### Syntax editor
The syntax editor allows you to enter and edit a description of your model using Amos's [model specification language](#t_language-for-model-specificati).
###### Model specification language
Amos's model specification language consists of [statements](#t_statements) and [comments](#t_comments). The present topic and subtopics describe the language informally through the use of examples. See the topic [EBNF grammar](#t_ebnf-grammar) for a formal description of the language.
###### Statements
There are three kinds of model specification statements.
1. Statements that specify a r[egression](#t_regression-equations) equation
2. Statements that specify a [covariance](#t_covariances) between two variables
3. Statements that specify the [variance](#t_variances-and-means) (and also the mean, if means and intercepts are explicit model parameters) of a single variable
A statement starts at the beginning of a line.
###### Regression equations
There is some flexibility in the way linear dependencies among variables can be specified. The following lines are equivalent ways of specifying that the variable yyy depends linearly on the variables xxx1, xxx2 and error1.
yyy = xxx1 xxx2 error1 yyy <- xxx1 xxx2 error1 yyy = xxx1 + xxx2 + error1 yyy = ()xxx1 + ()xxx2 + ()error1 yyy = ()\*xxx1 + ()\*xxx2 + ()\*error1 yyy = () \* xxx1 + () \* xxx2 + () \* error1
As those examples illustrate,
- Plus signs (+) and asterisks (\*) are optional. Use them if you think it makes the syntax more readable.
- Empty parentheses represent regression weights that need to be estimated. The empty parentheses are optional.
- "=" and "<-" are equivalent in meaning.
- White space (spaces and tab characters) can be used anywhere to make the text easier to read, except that a line that begins with white space is treated as a [continuation](#t_continuing-a-statement-across-) of the preceding line.
If means and intercepts are explicit model parameters (see [Estimate means and intercepts](#t_estimatemeansandintercepts1),) an intercept must appear in each regression equation, as follows.
yyy = () + xxx1 xxx2 error1 yyy = () + xxx1 + xxx2 + error1 yyy = () + ()xxx1 + ()xxx2 + ()error1 yyy = () + ()\*xxx1 + ()\*xxx2 + ()\*error1
The empty parentheses and the plus sign in "() +" are required in order to specify the presence of an intercept. This is the only context in which empty parentheses and the plus sign are not optional.
Each of the following equivalent lines specifies that error1 has a fixed weight of 1 in predicting yyy while the weights for xxx1 and xxx2 are unconstrained.
yyy = xxx1 xxx2 (1) error1 yyy = xxx1 + xxx2 + (1) error1 yyy = () xxx1 + () xxx2 + (1) error1
Each of the following equivalent lines specifies that the weight for xxx1 is named alpha and the weight for xxx2 is also named alpha. This means that the two regression weight estimates are constrained to be equal. The weight for error1 is also fixed at a constant value of 1.
yyy = (alpha )xxx1 (alpha) xxx2 (1) error1 yyy = (alpha) xxx1 + (alpha) xxx2 + (1) error1
In the following line, the intercept in the equation for predicting yyy is named gamma, and the weight for error1 is fixed at a constant 1.
yyy = (gamma) + ()xxx1 + ()xxx2 + (1)error1
###### Covariances
The following lines are equivalent ways of specifying that the variables xxx and yyy may be correlated and that their covariance is to be estimated.
xxx <> yyy xxx<>yyy xxx yyy xxx yyy ()
As those examples illustrate,
- "<>" is optional. "<>" is treated as a single symbol. "<" cannot appear by itself. Neither can ">". Also, "< >" (with an embedded space) is not recognized.
- Empty parentheses represent covariances that need to be estimated. These empty parentheses are optional.
- White space (spaces and tab characters) can be used anywhere to make the text easier to read, except that a line that begins with white space is treated as a [continuation](#t_continuing-a-statement-across-) of the preceding line.
You can fix a covariance at a constant value, say 1 as in the following line.
xxx yyy (1)
And you can name a covariance. In the following line the covariance between xxx and yyy is given the name, alpha. If any another covariances are also called alpha, then the estimates of all the covariances called alpha will be constrained to be equal.
xxx yyy (alpha)
###### Variances and means
###### When means and intercepts are not explicit model parameters.
The following lines are equivalent. Either line by itself states that xxx is an exogenous variable and that its variance is unconstrained
xxx xxx ()
Instead of estimating the variance of xxx, you can set its value to a constant, say a constant 1, as follows.
xxx (1)
You can estimate the variance of xxx while providing a starting value (an initial guess) for the variance estimate. The following line provides a starting value of 55 for the variance of xxx.
xxx (55?)
The following line estimates the variance of xxx and also gives the variance the name "alpha". If there is more than one variances named "alpha" then all of their estimates will be constrained to be equal.
xxx (alpha)
The following line estimates the variance of xxx, gives the variance the name "alpha", and assigns a starting value of 55.
xxx (alpha : 55)
###### When means and intercepts are explicit model parameters.
The following lines are equivalent. Either line by itself states that xxx is an exogenous variable and that its mean and variance are both unconstrained
xxx xxx (), ()
You can constrain a variable's mean and/or its variance. The following line sets xxx's mean to a constant 0 and its variance to a constant 1.
xxx (0), (1)
The following line sets the mean of xxx to a constant 0, and also gives its variance the name alpha and a starting value of 55.
xxx (0), (alpha : 55)
When means and intercepts are explicit model parameters, a single variable name must be followed by one of the following.
- Two pairs of parentheses separated by a comma
- Nothing at all
Here are some correct and incorrect examples.
xxx1{correct} xxx2 (),(){correct} xxx3 (),{incorrect} xxx4 (0),{incorrect} xxx5 ,(1){incorrect} xxx6 ,{incorrect}
###### Continuing a statement across multiple lines
If you type a statement that is too long to fit on one line, the editor will "wrap" the statement in order to allow it to continue onto additional lines. In other words, just keep typing and the editor will automatically continue the statement onto as many lines as needed.
There is an alternative way of dealing with long statements that gives you more control over the formatting of a statement that extends across multiple lines. A line that begins with a space or tab character is treated as a continuation of the preceding line. To continue a statement on an additional line, press the ENTER key and then type a space or tab character at the beginning of the next line. For example, the statement
y = x1 + x2 + x3 + (1) error
can be written using four lines as follows:
y = x1 + x2 + x3 + (1) error
where lines 2, 3 and 4 each begin with a space and are therefore treated as continuations of the statement that begins in line 1.
###### Comments
Any text between curly braces is treated as a comment. For example,
xxx {This is a comment.} yyy
is treated the same as.
xxx yyy
Comments can extend across multiple lines. For example,
xxx <> yyy{This is a multi-line comment.} uuu <> vvv
is treated the same as
xxx <> yyy uuu <> vvv
Note: If you change the model while in Path Diagram view, the comments that you entered in Syntax view will be lost.
###### EBNF grammar
The EBNF (Extended Backus-Naur Form) grammar for Amos's model specification language is shown below. Hopefully, the informal description of the language provided in other topics will enable you to use the language without referring to the formal grammar.
There are two versions of the EBNF grammar. One version is used [when means and intercepts are explicitly estimated](#t_ebnf-grammar-with-explicit-mea). The other version is used [when means and intercepts are not explicitly estimated](#t_ebnf-grammar-without-explicit-). Both versions of the EBNF grammar are defined in terms of the following tokens. The token definitions are in most cases apparent from the token names.
- @AColon
- @Addition (+)
- @AQuestionMark
- @Assignment (=)
- @Asterisk
- @CloseParenthesis
- @Comma
- @Covariance (<>)
- @Dependency (<-)
- @IntegerNumber
- @LineTerminator
- @OpenParenthesis
- @ParameterName
- @RealNumber
- @SemiColon
- @VariableName
###### EBNF grammar without explicit means and intercepts
The following grammar is used for model specification when you do not [estimate means and intercepts](#t_estimatemeansandintercepts1) as explicit model parameters.
ModelSpecification
: Statement\*
;
Statement
: EmptyStatement
| AssignmentStatement
| CovarianceStatement
| VariableStatement
;
EmptyStatement
: StatementDelimiter
;
StatementDelimiter
: @SemiColon
| @LineTerminator
;
AssignmentStatement
: @VariableName ( @Assignment | @Dependency) Expression StatementDelimiterOrDocumentEnd
;
Expression
: AdditiveExpression
;
AdditiveExpression
: PrimaryExpression ( @Addition? AdditiveExpression )?
;
PrimaryExpression
: PrefixedVariableName
| @VariableName
;
PrefixedVariableName
: ParameterSpecification @Asterisk? @VariableName
;
ParameterSpecification
: emptyParen
| (
(
@OpenParenthesis (
StartValue
| ParamNameAndStartValue
| FixedValue
| AltParameterName
) @CloseParenthesis
)
)
;
emptyParen
: @OpenParenthesis @CloseParenthesis
;
StartValue
: Number @AQuestionMark
;
Number
: @IntegerNumber
| @RealNumber
;
ParamNameAndStartValue
: @ParameterName @AColon Number
;
FixedValue
: Number
;
AltParameterName
: @ParameterName
;
StatementDelimiterOrDocumentEnd
: StatementDelimiter
| @DocumentEnd
;
CovarianceStatement
: @VariableName @Covariance? @VariableName ParameterSpecification? StatementDelimiterOrDocumentEnd
;
VariableStatement
: @VariableName ParameterSpecification? StatementDelimiterOrDocumentEnd
;
###### EBNF grammar with explicit means and intercepts
The following grammar is used for model specification when you [estimate means and intercepts](#t_estimatemeansandintercepts1) as explicit model parameters.
ModelSpecification
: Statement\*
;
Statement
: EmptyStatement
| AssignmentStatement
| CovarianceStatement
| VariableStatement
;
EmptyStatement
: StatementDelimiter
;
StatementDelimiter
: @SemiColon
| @LineTerminator
| @SingleLineCommentStartDelimiter
;
AssignmentStatement
: @VariableName (
@Assignment
| @Dependency
) Expression StatementDelimiterOrDocumentEnd
;
Expression
: ParameterSpecification @Addition AdditiveExpression
;
ParameterSpecification
: emptyParen
| (
(
@OpenParenthesis (
StartValue
| ParamNameAndStartValue
| FixedValue
| AltParameterName
) @CloseParenthesis
)
)
;
emptyParen
: @OpenParenthesis @CloseParenthesis
;
StartValue
: Number @AQuestionMark
;
Number
: @IntegerNumber
| @RealNumber
;
ParamNameAndStartValue
: @ParameterName @AColon Number
;
FixedValue
: Number
;
AltParameterName
: @ParameterName
;
AdditiveExpression
: PrimaryExpression ( @Addition? AdditiveExpression )?
;
PrimaryExpression
: PrefixedVariableName
| @VariableName
;
PrefixedVariableName
: ParameterSpecification @Asterisk? @VariableName
;
StatementDelimiterOrDocumentEnd
: StatementDelimiter
| @DocumentEnd
;
CovarianceStatement
: @VariableName @Covariance? @VariableName ParameterSpecification? StatementDelimiterOrDocumentEnd
;
VariableStatement
: @VariableName ( ParameterSpecification @Comma ParameterSpecification )? StatementDelimiterOrDocumentEnd
;
###### To search for text in the syntax editor
To search for text in the syntax editor, press CTRL-I.
The syntax editor performs an "incremental search", which is different from the kind of text search that you are probably used to.
After you press CTRL-I, the mouse pointer changes to indicate that you are performing an incremental search. Start typing the string that you want to search for. Say you start to type "authoritarianism". As soon as you type the character "a", the syntax editor highlights the first occurrence of "a" that it finds. Next type "u", and the syntax editor highlights the first occurrence of "au" that it finds. And so on.
After you have found one occurrence of the text you are searching for, press CTRL-I again to search for the next occurrence.
If "authoritarianism" is present in the text, there is a good chance that you will find it before typing the entire word.
TIP: It can be useful to specify highlighting for [matching strings](#t_matching-strings) before performing an incremental search.
###### Labor saving features
When entering text in the editor, you do not have to type variable names or parameter names if Amos already "knows about" them. Amos knows about a variable name or parameter name if you have used it previously in the current \*.amw file. It also knows about the variable names in the data file. (This is a good reason to specify the data file before entering text in the editor.)
You can drag and drop variable names from the [view variables in model](#t_viewvariablesinmodel) dialog and the [view variables in dataset](#t_viewvariablesindataset) dialog.
You can drag and drop parameter names and values from the [view parameters](#t_viewparameters) dialog.
When cursor (the blinking vertical line) is positioned at a place where you want to type a variable name or a parameter name, press CTRL-Space. Amos will show a popup menu of variable names or parameter names, whichever is appropriate.
##### Syntax errors
Any syntax errors are listed here, with each error on a separate line.
Some simple errors that are not syntax errors are also listed here. For example, a variable's name is not allowed to appear twice on the right-hand side of a regression equation, and, if it does, that error will be listed here.
Double-click an error description, and the cursor will move to the location of the error in the editor's text.
### Main menu
**Keyboard navigation**: Use TAB to cycle through the elements of this window. Use CTRL-1, CTRL-2,...,CTRL-7 to move the keyboard focus to a specific element. Use CTRL-F10 to toggle between the input path diagram and the output path diagram.
- [File menu](#t_file-menu)
- [Edit menu](#t_edit-menu)
- [View menu](#t_view-menu)
- [Diagram menu](#t_diagram-menu)
- [Analyze menu](#t_analyze-menu)
- [Tools menu](https://ai-docs.amosdevelopment.com/03-amos-graphics-reference-guide-part-2.md#t_tools-menu)
- [Plugins menu](https://ai-docs.amosdevelopment.com/03-amos-graphics-reference-guide-part-2.md#t_plugins-menu)
- [Help menu](https://ai-docs.amosdevelopment.com/03-amos-graphics-reference-guide-part-2.md#t_help-menu)
#### File menu
*Help context ID: 3917*
Menu: **File**
- [File→New](#t_startanewpathdiagram) (Start a new path diagram)
- [File→New with Template](#t_startapathdiagramusingatemplate) (Start a path diagram using a template)
- [File→Open](#t_readanoldpathdiagramfromdisk) (Read an old path diagram from disk)
- [File→Retrieve Backup](#t_retrieveapreviousbackup) (Retrieve a previous backup)
- [File→Save](#t_saveapathdiagram) (Save a path diagram)
- [File→Save As](#t_saveapathdiagramwithanewname) (Save a path diagram with a new name)
- [File→Save As Template](#t_saveapathdiagramasatemplate) (Save a path diagram as a template)
- [File→Data Files](#t_specifydatafiles) (Specify data files)
- [File→Run Default App](#t_run-default-app) (Run the default app for viewing/analyzing Amos's data)
- [File→Print](#t_printapathdiagram) (Print a path diagram)
- [File→Browse Path Diagrams](#t_pathdiagramviewer1)
- [File→File Manager](#t_filemanager1)
- [File→File Explorer](#t_file-explorer)
- [File→Exit](#t_exitfromamos)
##### Start a new path diagram
*Help context ID: 38*
Menu: **File****®****New**
Pressing [](#t_startanewpathdiagram) starts a new path diagram. If you are already working on a path diagram when you press [](#t_startanewpathdiagram), you will be asked if you want to save it before starting a new one.
##### Start a path diagram using a template
*Help context ID: 95*
Menu: **File****®****New with Template...**
Pressing [](#t_startapathdiagramusingatemplate) starts a new path diagram after asking you to choose a template. By contrast, [](#t_startanewpathdiagram) starts a new path diagram using the default template in the file, **normal.amt**.
See also:
[](#t_startanewpathdiagram) [Start a new path diagram](#t_startanewpathdiagram)
[What is a template?](#t_whatisatemplate)
##### Read an old path diagram from disk
*Help context ID: 39*
Menu: **File****®****Open...**
Pressing [](#t_readanoldpathdiagramfromdisk) allows you to retrieve a path diagram that you saved previously.
See also:
[](#t_saveapathdiagram) [Save a path diagram](#t_saveapathdiagram)
###### Unconverted lines
*Help context ID: 3171*
The contents of the '$' window in an Amos 3.6 path diagram are displayed here. These lines are not converted to the current path diagram file format. The information contained in these lines must be manually re-entered in the new format. For example, if this window contains **$SMC** (specifying output of squared multiple correlations in Amos 3.6), you need to press [](#t_viewinterfaceproperties) and put a check mark next to **Squared multiple correlations** on the **Output** tab of the **Interface Properties** window.
##### Retrieve a previous backup
*Help context ID: 70*
Menu: **File****®****Retrieve Backup...**
Pressing [](#t_retrieveapreviousbackup) allows you to choose from a list of previously backed up path diagrams:
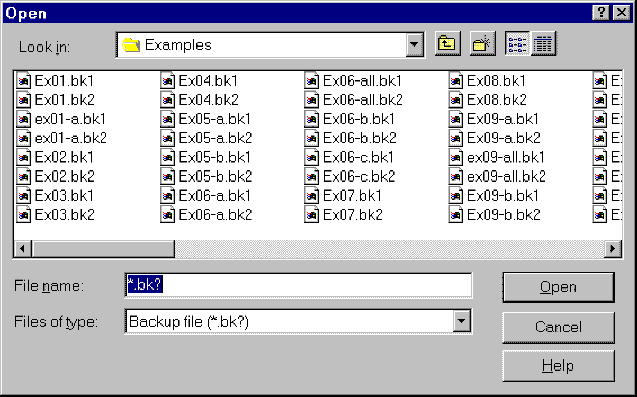
###### How backups work
To see how the backup capability works, suppose you have made several changes to a path diagram, saving it (using [](#t_saveapathdiagram)) multiple times in a file called **alpha.amw**. Then the most recently saved version of the path diagram is called **alpha.amw**. The version before that is called **alpha.bk1**. The version before **alpha.bk1** is called **alpha.bk2**. And so on. You can specify as many as nine backups (the oldest version would then have a name that ends with .bk9), or you can specify that no backups be kept.
See [To specify how many backups to keep](https://ai-docs.amosdevelopment.com/03-amos-graphics-reference-guide-part-2.md#t_tospecifyhowmanybackupstokeep1)
##### Save a path diagram
*Help context ID: 40*
Menu: **File****®****Save**
Shortcut: **Ctrl-S**
Pressing [](#t_saveapathdiagram) allows you to save the path diagram as a file. The first time you save a path diagram, you will be asked to give it a name. If you subsequently make changes to the path diagram and press [](#t_saveapathdiagram) again, the updated version will replace the original version.
To save a path diagram under a new name (so as not to overwrite an existing file) use [](#t_saveapathdiagramwithanewname) instead.
To save a path diagram to a file that can be read by earlier versions of Amos, going back as far as Amos 5, use [](#t_saveapathdiagramwithanewname).
See also:
[](#t_readanoldpathdiagramfromdisk) [Read an old path diagram from disk](#t_readanoldpathdiagramfromdisk)
[](#t_saveapathdiagramwithanewname) [Save a path diagram with a new name](#t_saveapathdiagramwithanewname)
##### Save a path diagram with a new name
*Help context ID: 41*
Menu: **File****®****Save As...**
To save a path diagram without destroying an earlier version, you need to save the new version under a new name. To do so, press [](#t_saveapathdiagramwithanewname).
In order to save a path diagram to a file that can be read by earlier versions of Amos, going back as far as Amos 5, select **Amos 5 Input file** in the **Save as type** box in the **Save As** dialog.

See also:
[](#t_saveapathdiagram) [Save a path diagram](#t_saveapathdiagram)
##### Save a path diagram as a template
*Help context ID: 96*
Menu: **File****®****Save As Template...**
[](#t_saveapathdiagramasatemplate) saves your path diagram as a template. You will be asked to specify a file name with a default extension of amt. If you specify the file name **normal.amt**, and save the file in the default directory, the template will be used every time you use [](#t_startanewpathdiagram) to start a new path diagram. If you save the template with a file name other than **normal.amt**, you must use [](#t_startapathdiagramusingatemplate) any time you want to use the template to start a new path diagram.
See also:
[What is a template?](#t_whatisatemplate)
###### What is a template?
A template is a path diagram that is saved in a file with a name of the form \*.amt. The "amt" file naming convention is the only thing that distinguishes a template from an ordinary path diagram. (Ordinary path diagrams are saved with file names of the form, \*.amw.)
The default template is called normal.amt. Whenever you start a new path diagram by pressing [](#t_startanewpathdiagram), the path diagram in normal.amt is used as the starting point for the new path diagram. You can also use [](#t_startapathdiagramusingatemplate) to start a new path diagram using a template other than normal.amt.
See also: [To create a new template](https://ai-docs.amosdevelopment.com/03-amos-graphics-reference-guide-part-2.md#t_tocreateanewtemplate1)
##### Specify data files
*Help context ID: 43*
Menu: **File****®****Data Files...**
Shortcut: **Ctrl-D**
The **Data Files** dialog allows you to specify the database file (or files) to be analyzed. It also allows you to restrict the analysis to a subset of the observations in a data set.
In a multiple-group analysis, data for each group can come from a different data file. The following dialog indicates that there are two samples – girls and boys. The girls' data are in the file, Grnt_fem.sav, which contains data on 73 girls. All 73 cases will be analyzed. The boys' data are in the file, Grnt_mal.sav, which contains data on 72 boys. All 72 cases will be analyzed.

Alternatively, data for all the groups can reside in a single data file, with group membership determined by the value of one of the variables in the data file. The following dialog indicates that there are two samples – boys and girls. The data for both samples are in the file, Grant.sav, which contains data on 73 girls and 72 boys. The girls' data consist of those cases for which the value of the **gender** variable is "female". The boys' data consist of those cases for which **gender** takes on the value "male".

[Dbfile]
See also:
[List of groups and datasets](#t_listofgroupsanddatasets1)
[Grouping Variable](#t_groupingvariable1)
[Group Value](#t_groupvalue1)
[File Name](#t_filename1)
[Working File](#t_workingfile1)
[OK](#t_ok)
[Cancel](#t_cancel)
[Help](#t_help)
[View Data (Data Files Dialog)](#t_viewdatadatafilesdialog)
###### List of groups and datasets
*Help context ID: 3101*
Displays a list of samples, showing the name of the data set that contains each sample's data.
Double-click a sample to change the name of its data set.
[ListView1]
###### File Name
*Help context ID: 3105*
Menu: **File****®****Data Files****®****File Name**
Specifies a data file. In a multiple-group analysis, each group can have its own data file.
Programming
To obtain a reference to this button in an Amos program, use the method [GetButton](https://ai-docs.amosdevelopment.com/04-programming-with-amos-part-1.md#t_7785)("Dbfile", "btnFileName").
###### Working File
*Help context ID: 3106*
Menu: **File****®****Data Files****®****Working File**
The **Working File** button specifies that the SPSS Statistics working data set is to be analyzed.
Programming
To obtain a reference to this button in an Amos program, use the method [GetButton](https://ai-docs.amosdevelopment.com/04-programming-with-amos-part-1.md#t_7785)("Dbfile", "btnWorkingFile").
###### Help
*Help context ID: 3109*
Menu: **File****®****Data Files****®****Help**
Displays help for this window.
Programming
To obtain a reference to this button in an Amos program, use the method [GetButton](https://ai-docs.amosdevelopment.com/04-programming-with-amos-part-1.md#t_7785)("Dbfile", "btnHelp").
###### View Data (Data Files Window)
*Help context ID: 3110*
Menu: **File****®****Data Files****®****View Data**
Displays a data file.
Programming
To obtain a reference to this button in an Amos program, use the method [GetButton](https://ai-docs.amosdevelopment.com/04-programming-with-amos-part-1.md#t_7785)("Dbfile", "btnViewData").
###### Data Viewer
*Help context ID: 4200*
The **Data Viewer** displays data files.
The **Data Viewer** window can be opened from Amos's main menu by clicking
**File****®****Data Files****®****View Data**
The **Data Viewer** can also be opened from the Windows **Start** menu as follows:
- Open the Windows **Start** menu and search for IBM SPSS Amos View Data.
###### File->Open (Data Viewer)
*Help context ID: 4204*
Displays the Windows file **Open** dialog, so that you can select a data file.
###### Format->List Font (Data Viewer)
*Help context ID: 4313*
Specifies a font for the list of data tables that appears on the left side of the **View Data** window when viewing a data file (such as an Excel or Access file) that contains multiple data tables.
###### Format->List Background
*Help context ID: 4315*
Specifies a background color for the list of data tables that appears on the left side of the **View Data** window when viewing a data file (such as an Excel or Access file) that contains multiple data tables.
###### Format->Grid Font
*Help context ID: 4314*
Specifies a font for displaying data.
###### Format->Grid Background
*Help context ID: 4316*
Specifies a background color for displaying data.
###### List of data tables (Data Viewer)
*Help context ID: 4202*
A list of the data tables in a data file.
###### Display of data
*Help context ID: 4201*
The data file contents appear here.
###### Grouping Variable
*Help context ID: 3102*
Menu: **File****®****Data Files****®****Grouping Variable**
Specifies a variable to be used for determining membership in the group that is selected in the listbox. For example, if the data set contains a **gender** variable that takes on values "male" and "female", the choice of **gender** as a grouping variable would allow the restriction of group membership to males only or to females only.
Programming
To obtain a reference to this button in an Amos program, use the method [GetButton](https://ai-docs.amosdevelopment.com/04-programming-with-amos-part-1.md#t_7785)("Dbfile", "btnGroupingVariable").
###### Group Value
*Help context ID: 3103*
Menu: **File****®****Data Files****®****Group Value**
Specifies the value that the grouping variable takes on for an individual sample.
Programming
To obtain a reference to this button in an Amos program, use the method [GetButton](https://ai-docs.amosdevelopment.com/04-programming-with-amos-part-1.md#t_7785)("Dbfile", "btnGroupValue").
###### OK
*Help context ID: 3107*
Closes the dialog box and saves any changes you have made.
Programming
To obtain a reference to this button in an Amos program, use the method [GetButton](https://ai-docs.amosdevelopment.com/04-programming-with-amos-part-1.md#t_7785)("Dbfile", "btnOK").
###### Cancel
*Help context ID: 3108*
Closes the dialog box and discards any changes you have made.
Programming
To obtain a reference to this button in an Amos program, use the method [GetButton](https://ai-docs.amosdevelopment.com/04-programming-with-amos-part-1.md#t_7785)("Dbfile", "btnCancel").
###### Allow non-numeric data
*Help context ID: 12105*
Menu: **File****®****Data Files****®****Allow non-numeric data**
Put a check mark next to **Allow non-numeric data** if you have non-numeric data such as censored data (Example 32) or ordered-categorical data (Example 33).
Also, put a check mark next to **Allow non-numeric data** if you are using Bayesian estimation and you want to view posterior predictive distributions of missing data values.
If you put a check mark next to [Assign cases to groups](#t_ag-dbfile-checkallowclustering) in order to do mixture modeling, the program will automatically put a check mark next to **Allow non-numeric data**.
Programming
To obtain a reference to this check box in an Amos program, use the method [GetCheckBox](https://ai-docs.amosdevelopment.com/04-programming-with-amos-part-1.md#t_7786)("Dbfile", "CheckDataScalingOptions").
###### Assign cases to groups
*Help context ID: 12106*
Menu: **File****®****Data Files****®****Assign cases to groups**
Put a check mark next to **Assign cases to groups** in order to do mixture modeling. The check mark tells Amos that it is ok to assign a case to a group whenever the dataset does not specify which group that case belongs to.
As an example, suppose you have the following dataset, which contains a grouping variable called **group**. The **group** variable assigns cases 1 and 2 to a group labeled **high** , and cases 3 through 5 to a group labeled **low**. Cases 6 through 14 are not assigned to any group.

If you put a check mark next to **Assign cases to groups**, the program will leave cases 1 through 5 in the groups to which they are preassigned, and will assign cases 6 through 14 to the **low** and **high** groups.
It is not necessary to pre-assign any cases to groups. With the following dataset, the program is free to assign each case to a group provided that you put a check mark next to **Assign cases to groups**.

If you put a check mark next to **Assign cases to groups**, the dataset must contain a grouping variable like the variable called **group** in the figures above. The grouping variable must be present even if it has no observed values. The grouping variable must be a non-numeric (string) variable, but it does not have to be called **group**. To specify the name of the grouping variable, click the **Grouping Variable** button.
If you put a check mark next to **Assign cases to groups**, the program will automatically put a check mark next to [Allow non-numeric data](#t_ag-dbfile-checkdatascalingoptions).
Programming
To obtain a reference to this check box in an Amos program, use the method [GetCheckBox](https://ai-docs.amosdevelopment.com/04-programming-with-amos-part-1.md#t_7786)("Dbfile", "CheckAllowClustering").
##### Run default app
Menu: **File****®****Run Default App**
Shortcut: **Ctrl-U**
Clicking **File****®****Run Default App** or typing the shortcut key **ctrl-u** runs the Windows default app for the current data file. For example, in Example 8 of the *User Guide*, the data file is grnt_fem.sav, so if you type the shortcut key ctrl-u, Amos will try to run SPSS Statistics to open grnt_fem.sav. Then you can use SPSS Statistics to edit or analyse the data. This assumes that you have SPSS Statistics installed. If you don't have SPSS Statistics installed, Windows will ask you what program you want to run.
Clicking **File****®****Run Default App** has the same effect as double-clicking the data file in Windows File Explorer. For an R data file, Amos will try to open the R program. For an Excel file, Amos will try to open Excel. For a text data file, Amos will typically open a text editor. And so on.
##### Print a path diagram
*Help context ID: 44*
Menu: **File****®****Print...**
Shortcut: **Ctrl-P**
Pressing this button displays a dialog box for printing path diagrams.
[mpick]
More:
[Groups (Print Dialog)](#t_groupsprintdialog)
[Models (Print Dialog)](#t_modelsprintdialog)
[Formats](#t_formats1)
[Print (Print Dialog)](#t_printprintdialog)
[Preview (Print Dialog)](#t_7724)
[Close (Print Dialog)](#t_closeprintdialog)
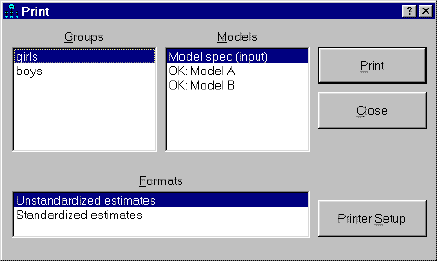
###### Groups (Print Dialog)
*Help context ID: 3301*
Allows you to pick the group (or groups) for which you want path diagrams printed.
Tip: To select more than one group, hold down the control key.
[List1]
###### Models (Print Dialog)
*Help context ID: 3302*
Allows you to pick the model (or models) for which you want path diagrams printed. Before carrying out an Amos analysis, this listbox contains only the item "Model spec (input)". After a successful Amos analysis, the listbox contains "Model spec (input)" along with all specified models (see [Manage models](#t_managemodels)).
Estimates can be displayed for all models listed in the format
"OK: ...".
An entry of the form
"XX: ...".
identifies a model for which parameter estimation was unsuccessful. It usually means that an error occurred during the most recent analysis. No usable parameter estimates or fit statistics are available for models marked "XX: ...".
When the Models listbox contains only the item "Model spec (input)", parameter estimates aren't available. This could be because you have not yet carried out an analysis by pressing [](#t_calculateestimates). Alternatively, it could mean that you have changed the path diagram so that the results of the most recent analysis are now obsolete. You have to re-fit your model (by pressing [](#t_calculateestimates)) whenever you change it, in order to bring the parameter estimates up to date.
Tip: To select more than one model, hold down the control key.
[List2]
###### Formats
*Help context ID: 3303*
Allows you to pick a format for displaying parameter values. The two items, "Unstandardized estimates" and "Standardized estimates" always appear in this listbox.Any formats that you have created also appear.
Tip: To select more than one format, hold down the control key.
[StyleList]
###### Print (Print Dialog)
*Help context ID: 3304*
Menu: **File****®****Print****®****Print**
Prints the path diagrams that are selected in the **Groups**, **Models** and **Formats** listboxes. It is possible that a large number of path diagrams will be printed. If you select, say, three items from **Groups**, four items from **Models** , and two items from **Formats** , then 24 path diagrams will be printed.
Programming
To obtain a reference to this button in an Amos program, use the method [GetButton](https://ai-docs.amosdevelopment.com/04-programming-with-amos-part-1.md#t_7785)("mpick", "printc").
###### Preview (Print Dialog)
*Help context ID: 3307*
Menu: **File****®****Print****®****Preview**
Shows on-screen how the path diagram will appear when printed. Here we show the **Print preview** window for Example 3.

Across the top of the Print Preview window are, from left to right, icons to print the document , zoom in on a section of the output , and display from one  to six pages  of output.
Programming
To obtain a reference to this button in an Amos program, use the method [GetButton](https://ai-docs.amosdevelopment.com/04-programming-with-amos-part-1.md#t_7785)("formclass_mpick", "btnPrintPreview").
###### Close (Print Dialog)
*Help context ID: 3306*
Closes the dialog box without printing any path diagrams.
Programming
To obtain a reference to this button in an Amos program, use the method [GetButton](https://ai-docs.amosdevelopment.com/04-programming-with-amos-part-1.md#t_7785)("mpick", "Command2").
##### Browse path diagrams
*Help context ID: 4100, 115*
Menu: **File****®****Browse Path Diagrams**
Display a thumbnail (a small picture) of the path diagram for each path diagram (\*.amw file) in the current directory. If a path diagram file contains multiple path diagrams for a multiple-group analysis, a thumbnail of the first group's path diagram is displayed.
You can use the scroll bar or the left- and right-arrow keys to scroll through the path diagrams
To open a path diagram in Amos graphics, double-click its picture. As an alternative, you can use the left- and right-arrow keys to select its picture and then press the Enter key.
##### File manager
*Help context ID: 104, 3600*
Menu: **File****®****File Manager...**
The **Amos File Manager** window displays a list of Amos Graphics path diagram files and other files that Amos creates. You can view the files or delete them. Files of the following types are displayed.
| File name extension | Description |
| --- | --- |
| ami | An Amos Text input file for Amos 3.6 . This file cannot be read by later versions of Amos. It is usually a straightforward task to manually translate an AMI file to a Visual Basic or C# program. |
| amj | An Amos 3.6 temporary file. Running Amos 3.6 with, say x.amw as input, creates x.amj. |
| amd | A data file in Amos 3.6 format. This file cannot be read by later versions of Amos. |
| amp | An output file that is used by Amos Graphics for displaying graphical output. This file can be re-created as long as the corresponding input (e.g., \*.amw, \*.AmosBasic, \*.vb or \*.cs) file and any required data files exist. |
| amo | A text output file created by Amos 4 and earlier versions of Amos. |
| amw | A path diagram file. Amos cannot re-create this file. |
| AmosBasic | An Amos Basic program used by Amos 4 and Amos 5. Amos cannot re-create this file. |
| AmosOutput | A text output file created by Amos 5 and later versions. This file can be re-created as long as the corresponding input (\*.amw or \*.AmosBasic) file and any required data files exist. |
| AmosP | A file that contains the "Function of log likelihood" statistics for the saturated and independence models, calculated from selected cases and selected variables within a single data set. Amos Graphics can re-create this file when the "Function of log likelihood" statistics are required. |
| AmosRecode | A file that contains the data recoding rules that you specify in the [Data Recode](https://ai-docs.amosdevelopment.com/03-amos-graphics-reference-guide-part-2.md#t_dataview-main-form1) window. The name of an AmosRecode file is assigned automatically by Amos, and is derived from the name of the raw data file that the data recoding rules apply to. For example, the data recoding rules for the data file abc.sav would be in a file called abc_sav.AmosRecode. If you move a raw data file from one directory to another, you should move its AmosRecode file along with it. For example, if you move abc.sav, you should move abc_sav.AmosRecode at the same time so that the two files end up together in the same directory. |
| AmosTN | A thumbnail image that appeared in the View Path Diagrams window in versions of Amos prior to Amos 18. For example, X.AmosTN contained a thumbnail image of the path diagram in the first group of X.amw. Amos 18 and subsequent versions of Amos do not create or use AmosTN files. |
| AmosMatrices | The matrix representation for a path diagram. For example, X.AmosMatrices contains the matrix representation for X.AMW. Amos cannot re-create this file. Not used by Amos 21 and later. |
###### File Manager Dialog
Menu: **File****®****File Manager**
###### File->Browse...
*Help context ID: 3601*
Menu: **File****®****File Manager****®****File****®****Browse**
Selects a folder for viewing in the File Manager.
###### File->Refresh
*Help context ID: 3602*
Menu: **File****®****File Manager****®****File****®****Refresh**
Refreshes the file list in the upper window of the **Amos File Manager** dialog.
###### File->View/Open
*Help context ID: 3603*
Menu: **File****®****File Manager****®****File****®****View/Open**
Displays the contents of the file that is selected in the upper window of the **Amos File Manager** dialog.
###### File->Delete
*Help context ID: 3604*
Menu: **File****®****File Manager****®****File****®****Delete**
Deletes the file that is selected in the upper window of the **Amos File Manager** dialog.
###### Format->Font... (File Manager)
*Help context ID: 3605*
Menu: **File****®****File Manager****®****Format****®****Font**
Specifies the font used in the **Amos File Manager** dialog.
###### Format->Background...
*Help context ID: 3606*
Menu: **File****®****File Manager****®****Format****®****Background**
Specifies the background color for the **Amos File Manager** dialog.
###### Help->Contents (File Manager)
*Help context ID: 3607*
Displays help for the **Amos File Manager** dialog.
###### Help->About (File Manager)
*Help context ID: 3608*
Displays version and copyright information.
###### File List (File Manager)
*Help context ID: 3609*
Menu: **File****®****File Manager**
Files that are used or created by Amos. Click on a column heading to sort by the contents of that column. For example, click on **Date** to sort by date.
"Orphan" in the **Notes** column indicates one of the following.
- An AMJ, AmosTN, or AmosMatrices file that has no matching AMW file.
- An AmosOutput, AMO or AMP file that has no matching AMW, AMI or AMJ file.
- An AmosP file that has no matching data file.
###### Browse (File Manager)
*Help context ID: 3611*
Selects a folder.
Same as [File→Browse](#t_filebrowse).
###### Refresh
*Help context ID: 3612*
Refreshes the file list in the upper window of the **Amos File Manager** dialog.
Same as [File→Refresh](#t_filerefresh).
###### View/Open
*Help context ID: 3613*
Displays the contents of the file that is selected in the upper window of the **Amos File Manager** dialog.
Same as [File→View/Open](#t_fileviewopen).
###### Delete (File Manager)
*Help context ID: 3614*
Deletes the file that is selected in the upper window of the **Amos File Manager** dialog.
Same as [File→Delete](#t_filedelete).
###### Summary
*Help context ID: 3610*
Menu: **File****®****File Manager**
A summary of the contents of the file that is selected in the upper window of the **Amos File Manager** dialog.
##### File explorer
*Help context ID: 121*
Menu: **File****®****File Explorer**
Show the current path diagram (\*.amw) file in Windows File Explorer. If you haven't saved your path diagram yet, File Explorer shows the default folder for saving path diagrams.
##### Exit from Amos
*Help context ID: 46*
Menu: **File****®****Exit**
Shortcut: **Alt-F4**
Press this button to exit from Amos.
#### Edit menu
*Help context ID: 3918*
Menu: **Edit**
- [Edit→Undo](#t_undothepreviouschange) (Undo the previous change)
- [Edit→Redo](#t_undothepreviousundo) (Undo the previous undo)
- [Edit→Copy (to clipboard)](#t_copyadiagramtotheclipboard) (Copy a diagram to the clipboard)
- [Edit→Paste](#t_pasteadiagramfromtheclipboard) (Paste a diagram from the clipboard)
- [Edit→Select](#t_selectoneobjectatatime) (Select one object at a time)
- [Edit→Select All](#t_selectallobjects) (Select all objects)
- [Edit→Deselect All](#t_deselectallobjects) (Deselect all objects)
- [Edit→Link](#t_linkobjects) (Link objects)
- [Edit→Move](#t_moveobjects) (Move objects)
- [Edit→Duplicate](#t_duplicateobjects) (Duplicate objects)
- [Edit→Erase](#t_eraseobjects) (Erase objects)
- [Edit→Move Parameter](#t_moveparameters) (Move parameter)
- [Edit→Reflect](#t_reflecttheindicatorsofalatentvariable) (Reflect the indicators of a latent variable)
- [Edit→Rotate](#t_rotatetheindicatorsofalatentvariable) (Rotate the indicators of a latent variable)
- [Edit→Shape of Object](#t_changetheshapeofobjects) (Change the shape of objects)
- [Edit→Space Horizontally](#t_spaceobjectshorizontally) (Space objects horizontally)
- [Edit→Space Vertically](#t_spaceobjectsvertically) (Space objects vertically)
- [Edit→Drag Properties](#t_dragpropertiesfromobjecttoobject) (Drag properties from object to object)
- [Edit→Fit to Page](#t_resizethediagramtofitonapage) (Resize the diagram to fit on a page)
- [Edit→Touch Up](#t_touchupavariable) (Touch up a variable)
##### Undo the previous change
*Help context ID: 51*
Menu: **Edit****®****Undo**
Shortcut: **Ctrl-Z**
Press this button to take back mistakes during creation or editing of a path diagram. By pressing n repeatedly, you can undo the four most recent changes.
*Note*: The "undo" function is not available immediately after switching to a different group or to a different model, or after performing any of the following operations.
[](#t_calculateestimates) [Calculate estimates](#t_calculateestimates)
[](#t_exitfromamos) [Exit from Amos](#t_exitfromamos)
[](#t_managegroups) [Manage groups](#t_managegroups)
[](#t_printapathdiagram) [Print a path diagram](#t_printapathdiagram)
[](#t_readanoldpathdiagramfromdisk) [Read an old path diagram from disk](#t_readanoldpathdiagramfromdisk)
[](#t_retrieveapreviousbackup) [Retrieve a previous backup](#t_retrieveapreviousbackup)
[](#t_saveapathdiagram) [Save a path diagram](#t_saveapathdiagram)
[](#t_saveapathdiagramasatemplate) [Save a path diagram as a template](#t_saveapathdiagramasatemplate)
[](#t_saveapathdiagramwithanewname) [Save a path diagram with a new name](#t_saveapathdiagramwithanewname)
[](#t_startanewpathdiagram) [Start a new path diagram](#t_startanewpathdiagram)
See also:
[](#t_undothepreviousundo) [Undo the previous undo](#t_undothepreviousundo)
##### Undo the previous undo
*Help context ID: 52*
Menu: **Edit****®****Redo**
Shortcut: **Ctrl-Y**
You can cancel the effect of the [](#t_undothepreviouschange) button by immediately pressing [](#t_undothepreviousundo).
See also:
[](#t_undothepreviouschange) [Undo the previous change](#t_undothepreviouschange)
##### Copy a diagram to the clipboard
*Help context ID: 53*
Menu: **Edit****®****Copy (to clipboard)**
Shortcut: **Ctrl-C**
This button copies the path diagram from the Amos window to the Windows clipboard. You can then paste the path diagram into the same Amos Graphics window or into another Amos Graphics window. You can also paste a copy of the path diagram into other applications, such as Microsoft Windows compliant word processors, graphics file utilities and spreadsheets.
If you have previously selected some objects (using [](#t_selectoneobjectatatime)), only the selected objects are copied to the clipboard.
Path diagrams are copied to the clipboard as bitmaps. As a result, image quality can deteriorate if a path diagram is pasted into another application and then re-sized in that other application. Microsoft Word 2007 and later versions, as well as Microsoft Excel 2007 and later versions, do an excellent job of re-sizing Amos's path diagrams. If it is necessary to enlarge or reduce a path diagram after it has been copied to the clipboard, one approach to preserving image quality is to paste the path diagram into Word or Excel and re-size it there.
See also:
[Paste a diagram from the clipboard](#t_pasteadiagramfromtheclipboard)
##### Paste a diagram from the clipboard
*Help context ID: 113*
Menu: **Edit****®****Paste**
Shortcut: **Ctrl-V**
This button pastes a path diagram, or a part of a path diagram, from the Windows clipboard into the Amos Graphics window.
See also:
[Copy a diagram to the clipboard](#t_copyadiagramtotheclipboard)
##### Select one object at a time
*Help context ID: 14*
Menu: **Edit****®****Select**
Shortcut: **F2**
When the [](#t_selectoneobjectatatime) is in the pressed position, you can select a group of objects by clicking on one object at a time. Every time you click on an object it changes color and becomes part of the "selected" group. By default, an object turns blue when it is selected, but you can pick another color by clicking **View****®****Interface Properties****®****Colors**. Another method of selecting objects one at a time is to hold the left mouse button down continuously and use the mouse pointer to touch every object that you want to select.
Clicking on an object that has already been selected has the effect of de-selecting it.
Amos provides several methods for manipulating a group of selected objects all at once. For example, you can move all of the selected objects at the same time. You can also change the size or shape of all the selected objects, or make a copy of the selected objects in one step. In order to operate on an entire group of objects, you first have to select the objects. Then carry out the operation.
The following operations can be applied to a group of selected objects.
[](#t_changetheshapeofobjects) [Change the shape of objects](#t_changetheshapeofobjects)
[](#t_duplicateobjects) [Duplicate objects](#t_duplicateobjects)
[](#t_moveobjects) [Move objects](#t_moveobjects)
[](#t_moveparameters) [Move parameters](#t_moveparameters)
[](#t_touchupavariable) [Touch up a variable](#t_touchupavariable)
The following operations are only meaningful after selecting a group of objects in advance.
[](#t_spaceobjectshorizontally) [Space objects horizontally](#t_spaceobjectshorizontally)
[](#t_spaceobjectsvertically) [Space objects vertically](#t_spaceobjectsvertically)
See also:
[](#t_deselectallobjects) [Deselect all objects](#t_deselectallobjects)
[](#t_selectallobjects) [Select all objects](#t_selectallobjects)
##### Select all objects
*Help context ID: 67*
Menu: **Edit****®****Select All**
Pressing [](#t_selectallobjects) selects all objects in the path diagram. Then you can use [](#t_selectoneobjectatatime) to de-select objects if necessary.
See also:
[](#t_deselectallobjects) [Deselect all objects](#t_deselectallobjects)
[](#t_selectoneobjectatatime) [Select one object at a time](#t_selectoneobjectatatime)
##### Deselect all objects
*Help context ID: 68*
Menu: **Edit****®****Deselect All**
Shortcut: **F11**
Pressing [](#t_deselectallobjects) clears all previous group selections.
See also:
[](#t_selectallobjects) [Select all objects](#t_selectallobjects)
[](#t_selectoneobjectatatime) [Select one object at a time](#t_selectoneobjectatatime)
##### Link objects
*Help context ID: 80*
Menu: **Edit****®****Link**
This button allows you to form groups of objects that will be treated as a unit in future operations. For example, moving one object that is "linked" to several other objects causes the entire collection of linked objects to move as a group. The following operations, when applied to an object that is part of a linked group, will affect all the objects in that group.
[](#t_changetheshapeofobjects) [Change the shape of objects](#t_changetheshapeofobjects)
[](#t_duplicateobjects) [Duplicate objects](#t_duplicateobjects)
[](#t_moveobjects) [Move objects](#t_moveobjects)
[](#t_moveparameters) [Move parameters](#t_moveparameters)
[](#t_touchupavariable) [Touch up a variable](#t_touchupavariable)
Linking a group of objects together is a two-step operation:
1. Select the group of objects to be linked using [](#t_selectoneobjectatatime).
2. Press [](#t_linkobjects).
To find out which objects are already linked to other objects, press [](#t_linkobjects) repeatedly. Each press of [](#t_linkobjects) will highlight a group of linked objects in a distinct color (blue, by default). To "unlink" a group of objects, press [](#t_linkobjects) repeatedly until the desired group of linked objects is highlighted. Then press [](#t_selectoneobjectatatime) and click on the objects that you want to unlink.
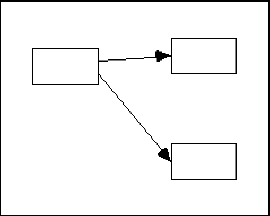
As an example of the effective use of [](#t_linkobjects), consider the following path diagram.
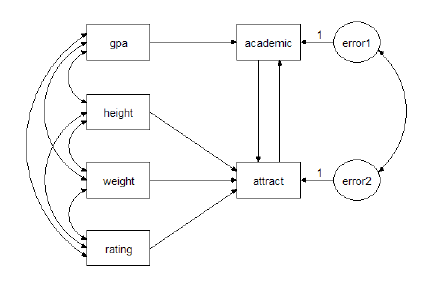
The four variables, gpa, height, weight and rating have similar roles in the model, and so they are good candidates for linking. Linking them is a three-step procedure:
1. Press [](#t_selectoneobjectatatime).
2. Select gpa, height, weight and rating.
3. Press [](#t_linkobjects).
Afterward, moving gpa will also cause height, weight and rating to move at the same time. Similarly, changing the size of any one of the four boxes will cause the other three to change size also.
In this example, it may also be worthwhile to link error1 and error2.
There is no limit on the number of "link" groups.
See also:
[](https://ai-docs.amosdevelopment.com/03-amos-graphics-reference-guide-part-2.md#t_preservesymmetries) [Preserve symmetries](https://ai-docs.amosdevelopment.com/03-amos-graphics-reference-guide-part-2.md#t_preservesymmetries)
[](#t_selectoneobjectatatime) [Select one object at a time](#t_selectoneobjectatatime)
##### Move objects
*Help context ID: 9*
Menu: **Edit****®****Move**
Shortcut: **Ctrl-M**
While [](#t_moveobjects) is in the pressed position, you can move objects around the page. Point to an object with the mouse and press the left mouse button. While holding the left mouse button down, move the object to its new position. Then release the mouse button.
To move an arrow, move one end at a time.
If you move a [selected variable](#t_selectoneobjectatatime) any other selected variables will move also.
When a group of selected variables is moved, any interconnecting arrows will move too. Any arrows that connect selected variables to unselected variables will be re-drawn.
*Note*: To move variables vertically or horizontally (but not diagonally), hold the shift key down.
See also:
[](#t_changetheshapeofobjects) [Change the shape of objects](#t_changetheshapeofobjects)
[](#t_duplicateobjects) [Duplicate objects](#t_duplicateobjects)
[](#t_spaceobjectshorizontally) [Space objects horizontally](#t_spaceobjectshorizontally)
[](#t_spaceobjectsvertically) [Space objects vertically](#t_spaceobjectsvertically)
##### Duplicate objects
*Help context ID: 10*
Menu: **Edit****®****Duplicate**
This button allows you to copy boxes, ellipses and captions. To make a copy of a single object, point to it with the mouse and press the left mouse button. While holding the left mouse button down, move the mouse pointer to the desired location of the new object. Then release the mouse button.
If you copy a [selected variable](#t_selectoneobjectatatime), all selected variables will be copied. Any arrows that connect selected variables will be copied too. Any arrows that connect selected variables to unselected variables will not be copied.
Note: Hold the shift key down while copying, and Amos aligns the copy (or copies) horizontally or vertically with the original(s).
See also:
[](#t_changetheshapeofobjects) [Change the shape of objects](#t_changetheshapeofobjects)
[](#t_moveobjects) [Move objects](#t_moveobjects)
##### Erase objects
*Help context ID: 5*
Menu: **Edit****®****Erase**
Shortcut: **Del**
While this button is in the pressed position, you can erase objects by clicking on them one at a time.
*Note*: You can erase only one object at a time, even if you erase an object that is part of a selected group or a linked group.
See also:
[](#t_linkobjects) [Link objects](#t_linkobjects)
[](#t_selectoneobjectatatime) [Select one object at a time](#t_selectoneobjectatatime)
[](#t_undothepreviouschange) [Undo the previous change](#t_undothepreviouschange)
##### Move parameter
*Help context ID: 23*
Menu: **Edit****®****Move Parameter**
To move parameters around, first press this button. Then point to an object that has a parameter that you want to move. For example, point to a single-headed arrow if you want to move the regression weight that is associated with it. Then press the left mouse button and move the mouse.
If you move a parameter associated with a selected object, parameters associated with other selected objects of the same kind will move too. For example, if you move a selected regression weight, any other selected regression weights also moves.
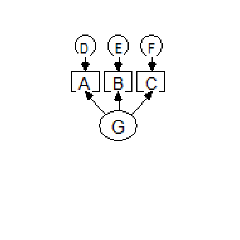
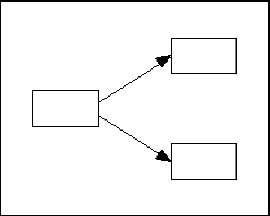
##### Reflect the indicators of a latent variable
*Help context ID: 76*
Menu: **Edit****®****Reflect**
After [](#t_reflecttheindicatorsofalatentvariable) has been pressed, the first click on a latent variable reflects its indicators and unique variables through a vertical axis that passes through the center of the latent variable. The second click on the same latent variable reflects its indicators and unique variables through a horizontal axis that passes through the center of the latent variable. The third click reflects through a vertical axis. The fourth click reflects through a horizontal axis. Four clicks in succession restore the latent variable, its indicators and its unique variables to their original state.
For example, clicking on the variable G in the following path diagram,
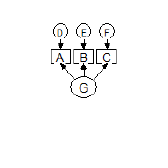 ,
yields this result:
 .
A second click yields
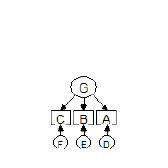 .
See also:
[](#t_drawlatentvariablesandindicators) [Draw latent variables and indicators](#t_drawlatentvariablesandindicators)
[](https://ai-docs.amosdevelopment.com/03-amos-graphics-reference-guide-part-2.md#t_preservesymmetries) [Preserve symmetries](https://ai-docs.amosdevelopment.com/03-amos-graphics-reference-guide-part-2.md#t_preservesymmetries)
[](#t_rotatetheindicatorsofalatentvariable) [Rotate the indicators of a latent variable](#t_rotatetheindicatorsofalatentvariable)
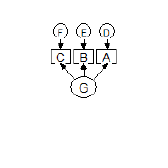
##### Rotate the indicators of a latent variable
*Help context ID: 75*
Menu: **Edit****®****Rotate**
When [](#t_rotatetheindicatorsofalatentvariable) is in the pressed position, clicking on a latent variable rotates its indicators and unique variables around the center of the latent variable. The rotation is 90 degrees clockwise. For example, clicking on the variable G in the following path diagram,
 ,
yields the following result:
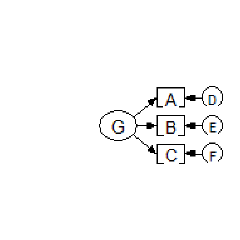 .
Four consecutive rotations return the indicators and unique variables to their original positions.
See also:
[](#t_drawlatentvariablesandindicators) [Draw latent variables and indicators](#t_drawlatentvariablesandindicators)
[](https://ai-docs.amosdevelopment.com/03-amos-graphics-reference-guide-part-2.md#t_preservesymmetries) [Preserve symmetries](https://ai-docs.amosdevelopment.com/03-amos-graphics-reference-guide-part-2.md#t_preservesymmetries)
[](#t_reflecttheindicatorsofalatentvariable) [Reflect the indicators of a latent variable](#t_reflecttheindicatorsofalatentvariable)
##### Change the shape of objects
*Help context ID: 24*
Menu: **Edit****®****Shape of Object**
To change the size and shape of a variable (rectangle or ellipse), press [](#t_changetheshapeofobjects). Then point to the variable, press the left mouse button and move the mouse. If you change the size and shape of a selected variable, the size and shape of other selected variables will also change.
To change the shape (curvature) of a double-headed arrow, press [](#t_changetheshapeofobjects). Then point to the double-headed arrow, press the left mouse button and move the mouse. If you change the curvature of a selected double-headed arrow, the curvature of other selected double-headed arrows will change too.
See also:
[](#t_duplicateobjects) [Duplicate objects](#t_duplicateobjects)
[](#t_moveobjects) [Move objects](#t_moveobjects)
##### Space objects horizontally
*Help context ID: 20*
Menu: **Edit****®****Space Horizontally**
To arrange objects so that they are equally spaced horizontally, first select them and then press [](#t_spaceobjectshorizontally). The objects don't have to be lined up in the same horizontal row to begin with. For example, you can make the following path diagram
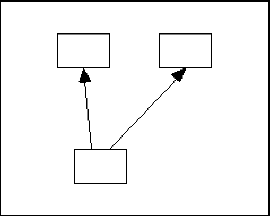
look like this
by selecting all three rectangles and pressing [](#t_spaceobjectshorizontally).
See also:
[](#t_moveobjects) [Move objects](#t_moveobjects)
[](#t_spaceobjectsvertically) [Space objects vertically](#t_spaceobjectsvertically)
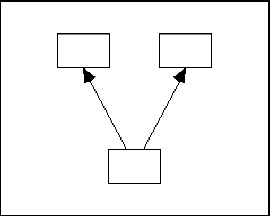
##### Space objects vertically
*Help context ID: 21*
Menu: **Edit****®****Space Vertically**
To arrange objects so that they are equally spaced vertically, first select them and then press [](#t_spaceobjectsvertically). The objects don't have to be lined up in a vertical column to begin with. For example, you can make the following path diagram
look like this
by selecting all three rectangles and pressing [](#t_spaceobjectsvertically).
See also:
[](#t_moveobjects) [Move objects](#t_moveobjects)
[](#t_spaceobjectshorizontally) [Space objects horizontally](#t_spaceobjectshorizontally)
##### Drag properties from object to object
*Help context ID: 86*
Menu: **Edit****®****Drag Properties**
Shortcut: **Ctrl-G**
The **Drag Properties** dialog allows you to copy the properties of one object to other objects.
[DragPropertiesForm]
###### Height (Drag Properties)
*Help context ID: 3151*
Menu: **Edit****®****Drag Properties****®****Height**
Checking this box allows you copy an object's height to another object.
See also:
[To make two objects have the same height](https://ai-docs.amosdevelopment.com/03-amos-graphics-reference-guide-part-2.md#t_tomaketwoobjectshavethesameheight1)
Programming
To obtain a reference to this check box in an Amos program, use the method [GetCheckBox](https://ai-docs.amosdevelopment.com/04-programming-with-amos-part-1.md#t_7786)("DragPropertiesForm", "chkHeight").
###### Width (Drag Properties)
*Help context ID: 3152*
Menu: **Edit****®****Drag Properties****®****Width**
Checking this box allows you copy an object's width to another object.
See also:
[To make two objects have the same width](https://ai-docs.amosdevelopment.com/03-amos-graphics-reference-guide-part-2.md#t_tomaketwoobjectshavethesamewidth1)
Programming
To obtain a reference to this check box in an Amos program, use the method [GetCheckBox](https://ai-docs.amosdevelopment.com/04-programming-with-amos-part-1.md#t_7786)("DragPropertiesForm", "chkWidth").
###### X coordinate
*Help context ID: 3153*
Menu: **Edit****®****Drag Properties****®****X coordinate**
Checking this box allows you copy an object's x (horizontal) coordinate to another object.
See also:
[To line up two objects in a vertical column](https://ai-docs.amosdevelopment.com/03-amos-graphics-reference-guide-part-2.md#t_tolineuptwoobjectsinaverticalcolumn1)
Programming
To obtain a reference to this check box in an Amos program, use the method [GetCheckBox](https://ai-docs.amosdevelopment.com/04-programming-with-amos-part-1.md#t_7786)("DragPropertiesForm", "chkXCoordinate").
###### Y coordinate
*Help context ID: 3154*
Menu: **Edit****®****Drag Properties****®****Y coordinate**
Checking this box allows you copy an object's y (vertical) coordinate to another object.
See also:
[To line up two objects in a horizontal row](https://ai-docs.amosdevelopment.com/03-amos-graphics-reference-guide-part-2.md#t_tolineuptwoobjectsinahorizontalrow1)
Programming
To obtain a reference to this check box in an Amos program, use the method [GetCheckBox](https://ai-docs.amosdevelopment.com/04-programming-with-amos-part-1.md#t_7786)("DragPropertiesForm", "chkYCoordinate").
###### Name
*Help context ID: 3155*
Menu: **Edit****®****Drag Properties****®****Name**
Checking this box allows you to copy an object's name to another object.
See also:
[To make two objects have the same name](https://ai-docs.amosdevelopment.com/03-amos-graphics-reference-guide-part-2.md#t_tomaketwoobjectshavethesamename1)
Programming
To obtain a reference to this check box in an Amos program, use the method [GetCheckBox](https://ai-docs.amosdevelopment.com/04-programming-with-amos-part-1.md#t_7786)("DragPropertiesForm", "chkName").
###### Parameter constraints (Drag Properties)
*Help context ID: 3156*
Menu: **Edit****®****Drag Properties****®****Parameter constraints**
Checking this box allows you to copy an object's parameter constraints to another object.
See also:
[To make two objects have the same parameter constraints](https://ai-docs.amosdevelopment.com/03-amos-graphics-reference-guide-part-2.md#t_tomaketwoobjectshavethesameparameterconstraints1)
Programming
To obtain a reference to this check box in an Amos program, use the method [GetCheckBox](https://ai-docs.amosdevelopment.com/04-programming-with-amos-part-1.md#t_7786)("DragPropertiesForm", "chkParameterConstraints").
###### Parameter position
*Help context ID: 3157*
Menu: **Edit****®****Drag Properties****®****Parameter position**
Checking this box allows you to copy an object's parameter position to another object.
See also:
[To make two objects have the same parameter position](https://ai-docs.amosdevelopment.com/03-amos-graphics-reference-guide-part-2.md#t_tomaketwoobjectshavethesameparameterposition1)
Programming
To obtain a reference to this check box in an Amos program, use the method [GetCheckBox](https://ai-docs.amosdevelopment.com/04-programming-with-amos-part-1.md#t_7786)("DragPropertiesForm", "chkParameterPosition").
###### Font
*Help context ID: 3158*
Menu: **Edit****®****Drag Properties****®****Font**
Checking this box allows you to copy an object's font to another object.
See also:
[To make two objects use the same font for variable names or captions](https://ai-docs.amosdevelopment.com/03-amos-graphics-reference-guide-part-2.md#t_tomaketwoobjectsusethesamefontforvariablenamesorcaptions1)
Programming
To obtain a reference to this check box in an Amos program, use the method [GetCheckBox](https://ai-docs.amosdevelopment.com/04-programming-with-amos-part-1.md#t_7786)("DragPropertiesForm", "chkFont").
###### Parameter font (Drag Properties)
*Help context ID: 3159*
Menu: **Edit****®****Drag Properties****®****Parameter font**
Checking this box allows you to copy an object's parameter font to another object.
See also:
[To make two objects use the same font for parameters](https://ai-docs.amosdevelopment.com/03-amos-graphics-reference-guide-part-2.md#t_tomaketwoobjectsusethesamefontforparameters1)
Programming
To obtain a reference to this check box in an Amos program, use the method [GetCheckBox](https://ai-docs.amosdevelopment.com/04-programming-with-amos-part-1.md#t_7786)("DragPropertiesForm", "chkParameterFont").
###### Pen width (Line width)
*Help context ID: 3160*
Menu: **Edit****®****Drag Properties****®****Pen width**
Checking this box allows you to copy an object's pen width (the width of the lines with with the object is drawn) to another object.
See also:
See [To make two objects have the same line width](https://ai-docs.amosdevelopment.com/03-amos-graphics-reference-guide-part-2.md#t_tomaketwoobjectshavethesamelinewidth1)
Programming
To obtain a reference to this check box in an Amos program, use the method [GetCheckBox](https://ai-docs.amosdevelopment.com/04-programming-with-amos-part-1.md#t_7786)("DragPropertiesForm", "chkPenwidth").
###### Curvature
*Help context ID: 3161*
Menu: **Edit****®****Drag Properties****®****Curvature**
Checking this box allows you to copy a double-headed arrow's curvature to another double-headed arrow.
See also:
See [To make two double-headed arrows have the same curvature](https://ai-docs.amosdevelopment.com/03-amos-graphics-reference-guide-part-2.md#t_tomaketwodoubleheadedarrowshavethesamecurvature)
Programming
To obtain a reference to this check box in an Amos program, use the method [GetCheckBox](https://ai-docs.amosdevelopment.com/04-programming-with-amos-part-1.md#t_7786)("DragPropertiesForm", "chkCurvature").
###### Colors (Drag Properties)
*Help context ID: 3162*
Menu: **Edit****®****Drag Properties****®****Colors**
Checking this box allows you to copy an object's colors to another object.
See also:
See [To make two objects have the same color](https://ai-docs.amosdevelopment.com/03-amos-graphics-reference-guide-part-2.md#t_tomaketwoobjectshavethesamecolor1)
Programming
To obtain a reference to this check box in an Amos program, use the method [GetCheckBox](https://ai-docs.amosdevelopment.com/04-programming-with-amos-part-1.md#t_7786)("DragPropertiesForm", "chkColors").
###### Visibility (Drag Properties)
*Help context ID: 3163*
Menu: **Edit****®****Drag Properties****®****Visibility**
Checking this box allows you to copy an object's visibility settings to another object.
See also:
[To make two objects have the same visibility settings](https://ai-docs.amosdevelopment.com/03-amos-graphics-reference-guide-part-2.md#t_tomaketwoobjectshavethesamevisibilitysettings1)
Programming
To obtain a reference to this check box in an Amos program, use the method [GetCheckBox](https://ai-docs.amosdevelopment.com/04-programming-with-amos-part-1.md#t_7786)("DragPropertiesForm", "chkVisibility").
##### Resize the diagram to fit on a page
*Help context ID: 37*
Menu: **Edit****®****Fit to Page**
Shortcut: **Ctrl-F**
Pressing this button resizes the path diagram so that it just fits on a page.
See also:
[To change the size of the path diagram](https://ai-docs.amosdevelopment.com/03-amos-graphics-reference-guide-part-2.md#t_tochangethesizeofthepathdiagram1)
##### Touch up a variable
*Help context ID: 66*
Menu: **Edit****®****Touch Up**
Shortcut: **Ctrl-H**
Use the [](#t_touchupavariable) button to rearrange the arrows in a path diagram in a way intended to be aesthetically pleasing.
After pressing [](#t_touchupavariable), click on a variable to reposition the arrows connected to it. For example, clicking on the variable, A, in the path diagram,
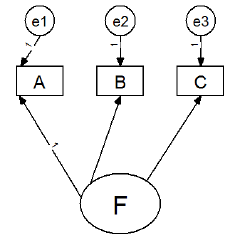
will produce the following result:
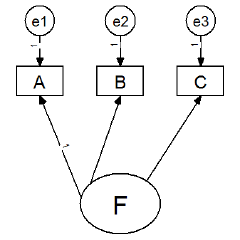
Then clicking on the variable, F, will produce the following path diagram.
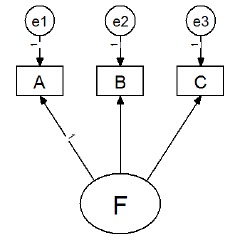
Note: You can specify whether arrows that touch a rectangle will be allowed to move to another side of the rectangle. (See [To allow arrows to change sides during touchup](https://ai-docs.amosdevelopment.com/03-amos-graphics-reference-guide-part-2.md#t_toallowarrowstochangesidesduringtouchup1).) For example, suppose you have the following path diagram.
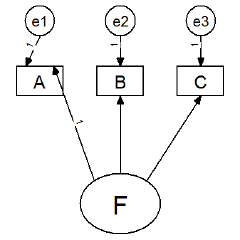
If you press [](#t_touchupavariable) and then click on variable A, there are two possible outcomes. If you have not checked the option "Allow arrows to change sides during touchup, the arrows will remain connected to the upper border of variable A. The "touched up" path diagram will look like this.
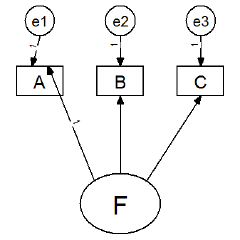
On the other hand, if you have checked the option "Allow arrows to change sides during touchup", the "touched up" path diagram will look like this.

If your path diagram contains two unobserved variables connected by arrows, it may be necessary to touch them both up two or three times, going back and forth between the two variables.
If you touch up a variable that has been selected using [](#t_selectoneobjectatatime), all selected variables will be touched up. If you touch up a variable that has been "linked" to other variables using [](#t_linkobjects), all of the linked variables will be touched up.
To touch up an entire path diagram, first use [](#t_selectallobjects) to select the entire path diagram. Then touch up any of its variables.
The [](#t_touchupavariable) button attempts to make a path diagram look good by following simple rules. You will need to experiment with this button to see if it produces results that are satisfactory to you.
See also:
[](#t_linkobjects) [Link objects](#t_linkobjects)
[](#t_selectoneobjectatatime) [Select one object at a time](#t_selectoneobjectatatime)
#### View menu
*Help context ID: 3919*
Menu: **View**
- [View→Interface Properties](#t_viewinterfaceproperties)
- [View→Analysis Properties](#t_viewanalysisproperties)
- [View→Object Properties](#t_viewobjectproperties)
- [View→Variables in Model](#t_viewvariablesinmodel)
- [View→Variables in Dataset](#t_viewvariablesindataset)
- [View→Parameters](#t_viewparameters)
- [View→Switch to Other View](#t_viewamatrixrepresentationofthemodel)
- [View→Text Output](#t_viewtextoutput)
- [View→Full Screen](#t_fullscreen1)
##### View interface properties
*Help context ID: 87*
Menu: **View****®****Interface Properties...**
Shortcut: **Ctrl-E**
Use the **Interface Properties** dialog to change the way you interact with the program, and to change the way the path diagram looks.
[InterfacePropertiesForm]
###### Page Layout tab
*Help context ID: 3282*
Menu: **View****®****Interface Properties****®****Page Layout**
Use the **Page Layout** tab to specify the dimensions of the path diagram, the width of its margins, whether it is to be displayed with a border, and whether it is to be printed in portrait or landscape mode.
###### Margins
*Help context ID: 3201*
Menu: **View****®****Interface Properties****®****Page Layout****®****Margins**
Specifies the width of the page margins that are imposed when you resize the path diagram by pressing [](#t_resizethediagramtofitonapage).
###### Top Margin
Menu: **View****®****Interface Properties****®****Page Layout****®****Margins****®****Top**
Specifies the size of the path diagram's top margin.
Programming
In Amos Graphics programs, you can fill this text box with "1" by using the following statement (Visual Basic):
Pd.GetTextBox("InterfacePropertiesForm", "TextMarginTop").Text = "1"
###### Bottom Margin
Menu: **View****®****Interface Properties****®****Page Layout****®****Margins****®****Bottom**
Specifies the size of the path diagram's bottom margin.
Programming
In Amos Graphics programs, you can fill this text box with "1" by using the following statement (Visual Basic):
Pd.GetTextBox("InterfacePropertiesForm", "TextMarginBottom").Text = "1"
###### Left Margin
Menu: **View****®****Interface Properties****®****Page Layout****®****Margins****®****Left**
Specifies the size of the path diagram's left margin.
Programming
In Amos Graphics programs, you can fill this text box with "1" by using the following statement (Visual Basic):
Pd.GetTextBox("InterfacePropertiesForm", "TextMarginLeft").Text = "1"
###### Right Margin
Menu: **View****®****Interface Properties****®****Page Layout****®****Margins****®****Right**
Specifies the size of the path diagram's right margin.
Programming
In Amos Graphics programs, you can fill this text box with "100" by using the following statement (Visual Basic):
Pd.GetTextBox("InterfacePropertiesForm", "TextMarginRight").Text = "100"
###### Paper Size for the Path Diagram
Menu: **View****®****Interface Properties****®****Page Layout****®****Paper Size**
You can use the drop down list to select a named paper size, such as "Portrait - A4" or "Landscape - Letter", for the path diagram. Alternatively, you can specify the paper's height and width.
See [To change the default paper size](https://ai-docs.amosdevelopment.com/03-amos-graphics-reference-guide-part-2.md#t_to_change_the_default_paper_si)
Programming
In Amos Graphics programs, you can select the first item in this ComboBox as follows (Visual Basic):
Dim aComboBox As Windows.Forms.ComboBox = Pd.GetComboBox("InterfacePropertiesForm", "ComboPaperSize") aComboBox.SelectedIndex = 0
###### Height (of path diagram)
Menu: **View****®****Interface Properties****®****Page Layout****®****Height**
Specifies the height of the path diagram.
Programming
In Amos Graphics programs, you can fill this text box with "11" by using the following statement (Visual Basic):
Pd.GetTextBox("InterfacePropertiesForm", "TextLayoutHeight").Text = "11"
###### Width (of path diagram)
Menu: **View****®****Interface Properties****®****Page Layout****®****Width**
Specifies the width of the path diagram.
Programming
In Amos Graphics programs, you can fill this text box with "8" by using the following statement (Visual Basic):
Pd.GetTextBox("InterfacePropertiesForm", "TextLayoutWidth").Text = "8"
###### Inches
*Help context ID: 3905*
Menu: **View****®****Interface Properties****®****Page Layout****®****Inches**
Specify the page layout in inch units.
Programming
In Amos Graphics programs, you can select inches as the unit of measurement by using the following statement (Visual Basic):
Pd.GetRadioButton("InterfacePropertiesForm", "OptionUnits_Inches").Checked = True
###### Centimeters
*Help context ID: 3906*
Menu: **View****®****Interface Properties****®****Page Layout****®****Centimeters**
Specify the page layout in centimeter units.
Programming
In Amos Graphics programs, you can select centimeters as the unit of measurement by using the following statement (Visual Basic):
Pd.GetRadioButton("InterfacePropertiesForm", "OptionUnits_Centimeters").Checked = True
###### Formats tab
*Help context ID: 3283*
Menu: **View****®****Interface Properties****®****Formats**
Use the **Formats** tab to specify how parameter estimates are to be displayed on the path diagram.
###### Table of available parameter formats
*Help context ID: 3211*
Menu: **View****®****Interface Properties****®****Formats**
Displays available formats for showing parameter estimates on the path diagram.
The table looks something like this:
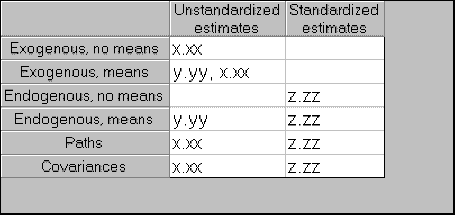
In this illustration there are two formats named "Unstandardized estimates" and "Standardized estimates". Each "format" is a set of templates that govern how parameters are displayed on a path diagram. There can be one template for exogenous variables when means are estimated, another template for exogenous variables when means aren't estimated, a template for regression weights, and so on.
###### Define a new format
*Help context ID: 3212*
Menu: **View****®****Interface Properties****®****Formats****®****New Format**
Press this button to create a new format for displaying parameter estimates on the path diagram.
See [To create a new format](#t_tocreateanewformat1).
Programming
In Amos Graphics programs, you can simulate clicking this button as follows (Visual Basic):
Dim aButton As Windows.Forms.Button = Pd.GetButton("InterfacePropertiesForm", "StylesNew") aButton.PerformClick
###### New Format dialog
*Help context ID: 3320*
Use the **New Format** dialog to enter a name for a new parameter format.
[stringin]
###### Enter a name for the new format
*Help context ID: 3321*
Enter a name for a new parameter format. The new name will appear on the format list along with **Unstandardized estimates** and **Standardized estimates**.
Programming
To obtain a reference to this text box in an Amos program, use the method [GetTextBox](https://ai-docs.amosdevelopment.com/04-programming-with-amos-part-1.md#t_7788)("stringin", "Text1").
###### OK
Closes the dialog box and saves any changes you have made.
Programming
To obtain a reference to this button in an Amos program, use the method [GetButton](https://ai-docs.amosdevelopment.com/04-programming-with-amos-part-1.md#t_7785)("stringin", "ok").
###### Cancel
Closes the dialog box and discards any changes you have made.
Programming
To obtain a reference to this button in an Amos program, use the method [GetButton](https://ai-docs.amosdevelopment.com/04-programming-with-amos-part-1.md#t_7785)("stringin", "cancel").
###### To create a new format
1. Press [](#t_viewinterfaceproperties) (Menu: **View****®****Interface Properties**).
2. Select **Formats**.
3. Press **New Format**. (The **New Format** dialog opens.)
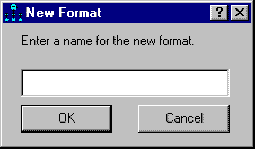
Say you call your new format "MyFormat". Then the **New Format** dialog then appears as follows.
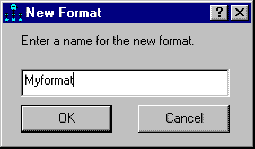
After you press **OK** the **Formats** tab has a new column labeled "MyFormat":
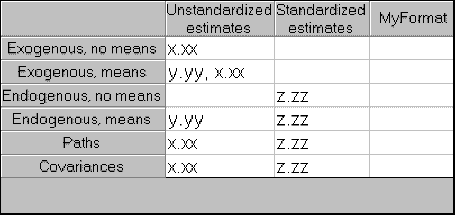
Now you can define the new format by typing templates into the empty spaces in the **MyFormat** column. A parameter template is a string of one of the following three forms:
| x.xx... | for (unstandardized) variances, covariances, and/or regression weights, |
| --- | --- |
| y.yy... | for means and intercepts, |
| z.zz... | for R2 values, correlations and standardized regression weights. |
It is necessary to define six templates -- one for each type of path diagram object that can have model parameters associated with it.
###### Exogenous, no means
When means are not estimated, an exogenous variable only has one parameter associated with it, namely its variance. Here is how various templates would cause a variance of 12.3456789 to be displayed:
| Template | Result | Comment |
| --- | --- | --- |
| x.xx | 12.35 | two places to the right of the decimal point |
| x.xxxxx | 12.34568 | five places to the right of the decimal point |
| [x.xx] | [12.35] | characters other than "x", "y", "z" and "." are copied from the template |
| x.xx\* | 12.35\* | |
###### Exogenous, means
When means are estimated, an exogenous variable has two parameters associated with it: its mean and variance. Here is how various templates would cause a mean of 1.11111111 and a variance of 22.22222222 to be displayed:
| Template | Result | Comment |
| --- | --- | --- |
| x.xx, y.yyy | 1.11, 22.222 | |
| y.yyy, x.xx | 22.222, 1.11 | |
| x.xx | 1.11 | the variance is not displayed |
| y.yyy | 2.222 | the mean is not displayed |
###### Endogenous, no means
"No means" is shorthand for "no means and no intercepts". When means and intercepts are not estimated, an endogenous variable has no parameters associated with it. However, Amos can display a squared multiple correlation for an endogenous variable if you have requested squared multiple correlations on the **Output** tab of the [](#t_viewanalysisproperties) window. Here is how various templates would cause a squared multiple correlation of .123456789 to be displayed:
| Template | Result |
| --- | --- |
| z.zz | .12 |
| z.zzz | .123 |
###### Endogenous, means
"Means" is shorthand for "means and intercepts". If means and intercepts are estimated, each endogenous variable is associated with a single intercept, which Amos can display on a path diagram. In addition, Amos can display a squared multiple correlation for an endogenous variable if you have requested squared multiple correlations on the **Output** tab of the [](#t_viewanalysisproperties) window. Here is how various templates would cause an intercept of 11.11111111 and a squared multiple correlation of .22222222 to be displayed:
| Template | Result |
| --- | --- |
| y.yy, z.zz | 11.11, .22 |
| z.zz, y.yy | .22, 11.11 |
| y.yy | 11.11 |
| z.zz | .22 |
###### Paths
Each path (single-headed arrow) is associated with a regression weight, and possibly a standardized regression weight if you have requested standardized estimates on the **Output** tab of the [](#t_viewanalysisproperties) window. Here is how various templates would cause a regression weight of 11.1111111 to be displayed, supposing that the same regression weight is .22222222 after standardizing all variables:
| Template | Result |
| --- | --- |
| x.xxx, z.zz | 11.111, .22 |
| z.zzz, x.xx | .222, 11.11 |
| x.xxx (z.zz) | 11.111 (.22) |
| .zzz\*\* | .222\*\* |
###### Covariances
Each covariance object (double-headed arrow) is associated with a covariance, and possibly a correlation (if you have requested standardized estimates on the **Output** tab of the [](#t_viewanalysisproperties) window.) Here is how various templates would cause a covariance of 11.1111111 to be displayed, supposing that the corresponding correlation is .22222222:
| Template | Result |
| --- | --- |
| x.xxx, z.zz | 11.111, .22 |
| z.zzz, x.xx | .222, 11.11 |
| x.xxx (z.zz) | 11.111 (.22) |
| .zzz\*\* | .222\*\* |
###### Leaving a template blank
No values will be displayed for a path diagram object that has a blank template. The "Standardized estimates" format, for example, has two blank templates.
###### Overriding a format
The formats defined on the **Formats** tab are global -- they affect all parameters. You can use the **Format** tab of the [](#t_viewobjectproperties) window to override the global formats for an individual parameter.
###### Delete the selected format
*Help context ID: 3213*
Menu: **View****®****Interface Properties****®****Formats****®****Delete Format**
Deletes one of the available formats for displaying parameter estimates on the path diagram.
See [To delete a format](#t_todeleteaformat1).
Programming
In Amos Graphics programs, you can simulate clicking this button as follows (Visual Basic):
Dim aButton As Windows.Forms.Button = Pd.GetButton("InterfacePropertiesForm", "StylesDelete") aButton.PerformClick
###### To delete a format
1. Press [](#t_viewinterfaceproperties) (Menu: **View****®****Interface Properties**).
2. Select **Formats**.
3. Click on the name of the format that you want to delete.
4. Press **Delete Format**.
Tip:
You can't delete the two default formats named "Unstandardized estimates" and "Standardized estimates".
###### Colors tab (Interface Properties dialog)
*Help context ID: 3284*
Menu: **View****®****Interface Properties****®****Colors**
The **Colors** tab affects the colors used to display the path diagram on the video screen. It has no effect on the path diagram's appearance when it is printed. (To change the colors used to print the path diagram, see [To change an object's colors](https://ai-docs.amosdevelopment.com/03-amos-graphics-reference-guide-part-2.md#t_tochangeanobjectscolors).)
###### Preview
*Help context ID: 3227*
Menu: **View****®****Interface Properties****®****Colors****®****Preview**
Displays a sample of your current color selection. If you want to use these colors for the path diagram, press **Apply**. If not, press **Cancel**.
###### Change highlight color
*Help context ID: 3221*
Menu: **View****®****Interface Properties****®****Colors****®****Highlighted**
Select this option to change the color that an object takes on when the mouse pointer passes over it.
See [To change the color used to highlight objects](https://ai-docs.amosdevelopment.com/03-amos-graphics-reference-guide-part-2.md#t_tochangethecolorusedtohighlightobjects1).
Programming
In Amos Graphics programs, you can select this option by using the following statement (Visual Basic):
Pd.GetRadioButton("InterfacePropertiesForm", "OptionColors_Highlighted").Checked = True
###### Change selection color
*Help context ID: 3222*
Menu: **View****®****Interface Properties****®****Colors****®****Selected**
Select this option to change the color that an object takes on when you select it with [](#t_selectoneobjectatatime) or [](#t_selectallobjects).
See [To change the color of selected objects](https://ai-docs.amosdevelopment.com/03-amos-graphics-reference-guide-part-2.md#t_tochangethecolorofselectedobjects1)
Programming
In Amos Graphics programs, you can select this option by using the following statement (Visual Basic):
Pd.GetRadioButton("InterfacePropertiesForm", "OptionColors_Selected").Checked = True
###### Change background color
*Help context ID: 3223*
Menu: **View****®****Interface Properties****®****Colors****®****Background**
Select this option to change the background color.
See [To change the background color of the path diagram](https://ai-docs.amosdevelopment.com/03-amos-graphics-reference-guide-part-2.md#t_tochangethebackgroundcolorofthepathdiagram1)
Programming
In Amos Graphics programs, you can select this option by using the following statement (Visual Basic):
Pd.GetRadioButton("InterfacePropertiesForm", "OptionColors_Background").Checked = True
###### System colors
*Help context ID: 3225*
Menu: **View****®****Interface Properties****®****Colors****®****System Colors**
Select a color for **Highlighted** objects, for **Selected** objects, or for the path diagram **Background**, depending on which of those three options is selected above.
Programming
In Amos Graphics programs, you can select the first item in this ComboBox as follows (Visual Basic):
Dim aComboBox As Windows.Forms.ComboBox = Pd.GetComboBox("InterfacePropertiesForm", "ColorsCombo1") aComboBox.SelectedIndex = 0
###### More Colors
*Help context ID: 3226*
Menu: **View****®****Interface Properties****®****Colors****®****More Colors**
Press this button to select a color from all the colors available on your system.
Programming
In Amos Graphics programs, you can click this button as follows (Visual Basic):
Dim aButton As Windows.Forms.Button = Pd.GetButton("InterfacePropertiesForm", "ColorsMore") aButton.PerformClick
###### Typefaces tab
*Help context ID: 3285*
Menu: **View****®****Interface Properties****®****Typefaces**
Use the **Typefaces** tab to specify typefaces for variable names, parameters and figure captions.
To change the fonts used for individual objects, see
- [To change the font for a variable name](https://ai-docs.amosdevelopment.com/03-amos-graphics-reference-guide-part-2.md#t_tochangethefontforavariablename1)
- [To change the font for a figure caption](https://ai-docs.amosdevelopment.com/03-amos-graphics-reference-guide-part-2.md#t_tochangethefontforafigurecaption1)
- [To change the font for a parameter](https://ai-docs.amosdevelopment.com/03-amos-graphics-reference-guide-part-2.md#t_tochangethefontforaparameter1)
###### Variable Names Typeface
*Help context ID: 3231*
Menu: **View****®****Interface Properties****®****Typefaces****®****Variable Names**
Select a typeface for variable names.
All variable names are displayed with the same typeface, but each variable name can be displayed in a different font. See [To change the font for a variable name](https://ai-docs.amosdevelopment.com/03-amos-graphics-reference-guide-part-2.md#t_tochangethefontforavariablename1).
Programming
In Amos Graphics programs, you can select the first item in this ComboBox as follows (Visual Basic):
Dim aComboBox As Windows.Forms.ComboBox = Pd.GetComboBox("InterfacePropertiesForm", "ComboTypefaces_VariableNames") aComboBox.SelectedIndex = 0
###### Parameter Values Typeface
*Help context ID: 3232*
Menu: **View****®****Interface Properties****®****Typefaces****®****Parameter Values**
Select a typeface for parameter names and values.
All parameter names and values are displayed with the same typeface, but each parameter name or value can be displayed in a different font. See [To change the font for a parameter](https://ai-docs.amosdevelopment.com/03-amos-graphics-reference-guide-part-2.md#t_tochangethefontforaparameter1).
Programming
In Amos Graphics programs, you can select the first item in this ComboBox as follows (Visual Basic):
Dim aComboBox As Windows.Forms.ComboBox = Pd.GetComboBox("InterfacePropertiesForm", "ComboTypefaces_ParameterValues") aComboBox.SelectedIndex = 0
###### Figure Captions Typeface
*Help context ID: 3233*
Menu: **View****®****Interface Properties****®****Typefaces****®****Figure Captions**
Select a typeface for figure captions.
All captions are displayed with the same typeface, but each caption can be displayed in a different font. See [To change the font for a figure caption](https://ai-docs.amosdevelopment.com/03-amos-graphics-reference-guide-part-2.md#t_tochangethefontforafigurecaption1).
Programming
In Amos Graphics programs, you can select the first item in this ComboBox as follows (Visual Basic):
Dim aComboBox As Windows.Forms.ComboBox = Pd.GetComboBox("InterfacePropertiesForm", "ComboTypefaces_Captions") aComboBox.SelectedIndex = 0
###### Variable Names Typeface Sample
*Help context ID: 3234*
Menu: **View****®****Interface Properties****®****Typefaces**
This box displays a sample of the typeface for variable names.
[_TypefacesSampleLabel_0]
###### Parameter Values Typeface Sample
*Help context ID: 3235*
Menu: **View****®****Interface Properties****®****Typefaces**
This box displays a sample of the typeface for parameter names and values.
[_TypefacesSampleLabel_1]
###### Figure Captions Typeface Sample
*Help context ID: 3236*
Menu: **View****®****Interface Properties****®****Typefaces**
This box displays a sample of the typeface for figure captions.
[_TypefacesSampleLabel_2]
###### Pen Width tab
*Help context ID: 3286*
Menu: **View****®****Interface Properties****®****Pen Width**
See [To specify the default line width (pen width)](#t_tochoosethewidthoflinesandarrowheads1).
See [To change the line width (pen width) for a single object](https://ai-docs.amosdevelopment.com/03-amos-graphics-reference-guide-part-2.md#t_tochangethewidthoflines1)
###### Printer Pen Width
*Help context ID: 3241*
Menu: **View****®****Interface Properties****®****Pen Width****®****Printer Pen Width**
Select the width (in units of 1/96 inch) of lines used to draw rectangles, ellipses and arrows.
See [To specify the default line width (pen width)](#t_tochoosethewidthoflinesandarrowheads1).
Programming
In Amos Graphics programs, you can obtain a reference to this NumericUpDown control as follows (Visual Basic):
Dim x As Windows.Forms.NumericUpDown = Pd.GetNumericUpDown("InterfacePropertiesForm", "NUpDownPenWidth")
###### To specify the default line width (pen width)
You can specify a default width for lines used to draw arrows, rectangles and ellipses. You can override the default line width on a case by case basis for individual objects.
###### To specify a default line width
1. Press [](#t_viewinterfaceproperties) (Menu: [View→Interface Properties](#t_viewinterfaceproperties)).
2. Select the **Pen Width** tab.
3. Select the **Printer Pen Width** (in units of 1/96 inch) to be used as the width of lines when drawing arrows, rectangles and ellipses. (The width of lines can be overridden for individual arrows, rectangles and ellipses, as explained below.)
See also:
[To change the line width (pen width) for a single object](https://ai-docs.amosdevelopment.com/03-amos-graphics-reference-guide-part-2.md#t_tochangethewidthoflines1)
[To make two objects have the same line width](https://ai-docs.amosdevelopment.com/03-amos-graphics-reference-guide-part-2.md#t_tomaketwoobjectshavethesamelinewidth1)
###### Arrowhead Size
*Help context ID: 3242*
Menu: **View****®****Interface Properties****®****Pen Width****®****Arrowhead Size**
Select the width (in units of 1/96 inch) of arrowheads.
See: [To specify the size of arrowheads](#t_to-choose-the-size-of-arrowhe)
Programming
In Amos Graphics programs, you can obtain a reference to this NumericUpDown control as follows (Visual Basic):
Dim x As Windows.Forms.NumericUpDown = Pd.GetNumericUpDown("InterfacePropertiesForm", "NUpDownArrowHeadWidth")
###### To specify the size of arrowheads
1. Press [](#t_viewinterfaceproperties) (Menu: [View→Interface Properties](#t_viewinterfaceproperties)).
2. Select the **Pen Width** tab.
3. Select the **Arrowhead Size** (in units of 1/96 inch).
Note: The same arrowhead size is used for all arrowheads, and cannot be overridden for individual arrowheads.
###### Misc tab
*Help context ID: 3287*
Menu: **View****®****Interface Properties****®****Misc**
Use the **Misc** tab to specify various interface properties.
###### Number of backups
*Help context ID: 3251*
Menu: **View****®****Interface Properties****®****Misc**
Selects the number of backup copies of the path diagram to keep.
See [How backups work](#t_howbackupswork1).
Programming
In Amos Graphics programs, you can select the first item in this ComboBox as follows (Visual Basic):
Dim aComboBox As Windows.Forms.ComboBox = Pd.GetComboBox("InterfacePropertiesForm", "MiscOptCombo") aComboBox.SelectedIndex = 0
###### Decimal places
*Help context ID: 3254*
Menu: **View****®****Interface Properties****®****Misc**
Specifies the precision with parameter estimates are represented when they are displayed in the [path diagram view](#t_drawingarea1) and the [syntax view](#t_syntax-view)
Programming
In Amos Graphics programs, you can select the first item in this ComboBox as follows (Visual Basic):
Dim aComboBox As Windows.Forms.ComboBox = Pd.GetComboBox("InterfacePropertiesForm", "ComboDplacesGeneral") aComboBox.SelectedIndex = 0
To select the second item use:
Dim aComboBox As Windows.Forms.ComboBox = Pd.GetComboBox("InterfacePropertiesForm", "ComboDplacesGeneral") aComboBox.SelectedIndex = 1
###### Decimal places for text macros
*Help context ID: 3252*
Menu: **View****®****Interface Properties****®****Misc**
Changes the precision with numbers are represented when they are substituted into [text macros](#t_textmacros1).
Programming
In Amos Graphics programs, you can select the first item in this ComboBox as follows (Visual Basic):
Dim aComboBox As Windows.Forms.ComboBox = Pd.GetComboBox("InterfacePropertiesForm", "ComboDplaces") aComboBox.SelectedIndex = 0
To select the second item use:
Dim aComboBox As Windows.Forms.ComboBox = Pd.GetComboBox("InterfacePropertiesForm", "ComboDplaces") aComboBox.SelectedIndex = 1
###### Snap spacing
*Help context ID: 3253*
Menu: **View****®****Interface Properties****®****Misc**
Select the spacing of an invisible grid that objects are forced to line up with, in units of 1/96 inch. For example, if you select a snap spacing of 24, then the invisible grid will have grid lines spaced 24/96 = .25 inches apart.
Select **Off** if you don't want to force objects to line up with a grid.
See [To force objects to line up on a grid](https://ai-docs.amosdevelopment.com/03-amos-graphics-reference-guide-part-2.md#t_toforceobjectstolineuponagrid1).
Programming
In Amos Graphics programs, you can select the first item in this ComboBox as follows (Visual Basic):
Dim aComboBox As Windows.Forms.ComboBox = Pd.GetComboBox("InterfacePropertiesForm", "SnapComboSnap") aComboBox.SelectedIndex = 0
###### Display variable labels
*Help context ID: 3248*
Menu: **View****®****Interface Properties****®****Misc**
Checking this box displays variable labels on the path diagram when variable labels are available. Variable labels can be obtained from SPSS Statistics data files. You can also enter variable labels manually. (See [To label a variable with a string other than its name](https://ai-docs.amosdevelopment.com/03-amos-graphics-reference-guide-part-2.md#t_tolabelavariablewithastringotherthanitsname1).)
Programming
In Amos Graphics programs, you can put a check mark in this check box by using the following statement (Visual Basic):
Pd.GetCheckBox("InterfacePropertiesForm", "chkDisplayVariableLabels").Checked = True
###### Allow arrows to change sides during touchup
*Help context ID: 3255*
Menu: **View****®****Interface Properties****®****Misc**
Checking this box allows arrows to change sides when you touch up the path diagram by pressing [](#t_touchupavariable).
See [To allow arrows to change sides during touchup](https://ai-docs.amosdevelopment.com/03-amos-graphics-reference-guide-part-2.md#t_toallowarrowstochangesidesduringtouchup1).
Programming
In Amos Graphics programs, you can put a check mark in this check box by using the following statement (Visual Basic):
Pd.GetCheckBox("InterfacePropertiesForm", "MiscOptCheck1").Checked = True
###### Give warning messages
*Help context ID: 3256*
Menu: **View****®****Interface Properties****®****Misc**
When this box is checked, Amos warns you about possible errors in a path diagram whenever you attempt an analysis.
See [To allow warning messages](https://ai-docs.amosdevelopment.com/03-amos-graphics-reference-guide-part-2.md#t_toallowwarningmessages1).
Programming
In Amos Graphics programs, you can put a check mark in this check box by using the following statement (Visual Basic):
Pd.GetCheckBox("InterfacePropertiesForm", "MiscOptCheck2").Checked = True
###### Display double arrowheads
*Help context ID: 3257*
Menu: **View****®****Interface Properties****®****Misc**
When this box is checked, double-headed arrows are displayed with arrowheads.
See [To display double arrowheads](https://ai-docs.amosdevelopment.com/03-amos-graphics-reference-guide-part-2.md#t_todisplaydoublearrowheads1).
Programming
In Amos Graphics programs, you can put a check mark in this check box by using the following statement (Visual Basic):
Pd.GetCheckBox("InterfacePropertiesForm", "MiscOptCheck3").Checked = True
###### Allow different path diagrams for different groups
*Help context ID: 3259*
Menu: **View****®****Interface Properties****®****Misc**
In a multi-group analysis, checking this box allows each group to have a different path diagram.
See [To allow different path diagrams for different groups](https://ai-docs.amosdevelopment.com/03-amos-graphics-reference-guide-part-2.md#t_toallowdifferentpathdiagramsfordifferentgroups1).
Programming
In Amos Graphics programs, you can put a check mark in this check box by using the following statement (Visual Basic):
Pd.GetCheckBox("InterfacePropertiesForm", "DistinctCheck").Checked = True
###### Show tabs
*Help context ID: 3214*
Menu: **View****®****Interface Properties****®****Misc**
Checking this box displays two tabs labeled **Path diagram** and **Tables** that you can use to choose between the Path diagram view and Tables view of your model. If the tabs are not visible, you can always [use the menu to switch between views](#t_viewamatrixrepresentationofthemodel).
Programming
n Amos Graphics programs, you can put a check mark in this check box by using the following statement (Visual Basic):
Pd.GetCheckBox("InterfacePropertiesForm", "CheckBoxShowTabs").Checked = True
###### Show the status bar
*Help context ID: 3215*
Menu: **View****®****Interface Properties****®****Misc**
Checking this box displays the status bar at the bottom of the Amos Graphics window.
Programming
In Amos Graphics programs, you can put a check mark in this check box by using the following statement (Visual Basic):
Pd.GetCheckBox("InterfacePropertiesForm", "CheckBoxShowStatusBar").Checked = True
###### More tab
Menu: **View****®****Interface Properties****®****More**
The **More** tab provides access to additional interface properties that don't fit on the **Misc** tab.
###### Automatically show output in Path Diagram view and Syntax view
*Help context ID: 3216*
Menu: **View****®****Interface Properties****®****More**
A check mark here causes Amos to automatically display parameter estimates in the [Path diagram view](#t_drawingarea1) and in the [Syntax view](#t_syntax-view) immediately after successfully fitting a model.
###### Automatically show text output
*Help context ID: 3217*
Menu: **View****®****Interface Properties****®****More**
A check mark here causes Amos to automatically display the text output in the [text output Viewer](#t_1083) immediately after successfully fitting a model.
###### Data focus
*Help context ID: 3218*
Menu: **View****®****Interface Properties****®****More**
A check mark here has the following effects:
1. The name of the data file appears in the window's title bar in place of the name of file that contains the model specification (the AMW file). In case the data file format supports multiple data tables (such as an excel workbook that may contain multiple worksheets), the name of the table is also displayed in the window's title bar.
2. The list of model files (AMW files) that is displayed in the lower left corner of the main window contains only the names of AMW files that specify alternative models for the data file named in the window's title bar.
###### Allow AI tools to use Amos (MCP)
Put a check mark here to allow AI tools to use Amos.
###### What can my AI app do with Amos?
Your AI app (be it ChatGPT, Claude Desktop, or something else) can:
1. Answer questions about your path diagram. For example:
1. "Tell me about the model in the path diagram"
2. "Is it recursive?"
3. "Is it identified?"
4. "How many degrees of freedom does it have?"
5. "Has this model been discussed in any published source?"
6. "Has this dataset been discussed anywhere?"
1. Give Amos instructions. For example, try telling your AI app:
1. "Start a new path diagram"
2. "Draw an observed variable named Anomia67"
3. "Make Anomia71 depend on Anomia67"
4. "Draw a factor called SES with two indicators called SEI and Education"
5. "Make Anomia67 twice as big and make its name half again as large"
6. "Make the latent variables green and the error variables purple"
7. "Use lighter colors"
8. "Lighter still"
1. Ask general questions about SEM or Amos. For example:
1. "How do I constrain two regression weights to be equal?"
###### Which AI applications can use Amos?
Many AI apps can use Amos. To name two well known ones, there are ChatGPT and Claude. There are others. Some are online services. There are also many that work offline. Do an online search to get a current list. You need to know that Amos makes itself available to AI using a protocol called MCP, so do a search something like "which AI apps can use MCP".
Advanced AI apps like ChatGPT and Claude can be especially helpful because they already know about SEM and Amos.
###### Configuring your AI app
Whatever AI app you use (ChatGPT, Claude, or something else), you have to tell it that Amos is available. You don't have to tell Amos anything about your AI app. Amos automatically makes itself available to any AI app that can use MCI servers. But you do have to tell your AI app about Amos.
You only have to go through this once for every AI app you want to allow to use Amos. You do not have to do this every time you want your AI app to use Amos.
If you use Claude Desktop, [you are in luck](#t_configuring-claude-desktop).
For the rest of you, the way you configure your AI app depends on what AI app your are using, and even on which version. You can try asking your AI app something like "How do I tell you about an MCP server that you can use." If you don't get a useful answer that way, one method that works in all cases I know about involves creating or editing a "config file", a text file whose name ends in ".json" You need to do two things:
1. [Find out the full name](#t_finding-out-the-full-name-of-t) of the config file, including the folder it resides in.
2. [Create the file](#t_creating-the-config-file-if-it) if it doesn't already exist, or [edit it](#t_editing-the-config-file-if-it-) if it does exist.
###### Configuring Claude Desktop
This topic is for Claude Desktop users only. To make Claude Desktop aware of Amos:
- Install Claude Desktop (if you haven't already done that) from [https://claude.com/download](<%LINK_CAPTION%>).
- In Claude Desktop, either (1) type **control-comma** at the keyboard or (2) click the hamburger menu icon (three horizontal lines stacked on top of each other) in the upper-left corner and select **File****®****Settings** from the menu that opens up.
- Click **Extensions** along the left side of the Settings window.
- Click the **Advanced Settings** button.
- Click the **Install Extensions** button in the lower-left corner.
- In the Select extension dialog, navigate to %LOCALAPPDATA%\AmosDevelopment\Amos\32\Tools\amos.mcpb and click the **Preview** button.
- Click the **Install** button.
- Click **Install** again when a dialog asks "Do you want to install IBM SPSS Amos?"
After going through those steps, if Claude still doesn't recognize Amos, you should:
- Quit Claude completely, which means more than closing the Claude window. You have to go to the "hamburger" menu in the upper-left corner of the Claude Desktop window and select File > Exit.
- Restart Claude.
- Start a new chat.
###### Finding out the full name of the config file
You need to know the full name of your configuration file, including the folder that contains it. For ecample, on the system where I am writing this, the full name (i.e., the full path) is "C:\Users\jim\AppData\Local\Packages\Claude_pzs8sxrjxfjjc\LocalCache\Roaming\Claude\claude_desktop_config.json". The full name is almost certainly different for you. Try asking your AI app something like "where is your configuration file located"
###### Creating the config file if it doesn't already exist
Create a file with the following contents: {
"mcpServers": {
"amos": {
"command": "C:/Users/jim/AppData/Local/AmosDevelopment/Amos/32/Tools/amos-mcp-bridge.exe"
}
}
}
###### Editing the config file if it already exists
I won't try to give instructions on modifying an existing configuration file. Instead, here are two examples. In these examples text is added to the configuration file. No text is changed or deleted. Your configuration file almost certainly differs from the ones in these examples. Hopefully though, you can figure out from these examples how to modify your own configuration file.
Example 1:
Here is an example configuration file that initially did not contain an mcpServers section. The red text was added to the file to make the AI app aware of Amos.
{
"mcpServers": {
"amos": {
"command": "C:/Users/jim/AppData/Local/AmosDevelopment/Amos/32/Tools/amos-mcp-bridge.exe"
}
},
"preferences": {
"coworkScheduledTasksEnabled": false,
"ccdScheduledTasksEnabled": true,
"sidebarMode": "chat",
"coworkWebSearchEnabled": true,
"remoteToolsDeviceName": "w11-x64",
"epitaxyPrefs": {
"starred-local-code-sessions": [],
"starred-cowork-spaces": [],
"starred-session-groups": [],
"dframe-local-slice": {
"pinnedOrder": [],
"customGroupAssignments": {},
"customGroupOrder": {}
}
}
}
}
Example 2:
Here is an example configuration file that initially contained an mcpServers section. The red text was added to the mcpServers section to make the AI app aware of Amos.
{
"$schema": "https://raw.githubusercontent.com/can1357/oh-my-pi/main/packages/coding-agent/src/config/mcp-schema.json",
"mcpServers": {
"amos": {
"command": "C:/Users/jim/AppData/Local/AmosDevelopment/Amos/32/Tools/amos-mcp-bridge.exe"
},
"slack": {
"type": "http",
"url": "https://mcp.slack.com/mcp",
"oauth": {
"clientId": "YOUR_SLACK_CLIENT_ID",
"clientSecret": "YOUR_SLACK_CLIENT_SECRET"
},
"auth": {
"type": "oauth",
"tokenUrl": "https://slack.com/api/oauth.v2.user.access",
"clientId": "YOUR_SLACK_CLIENT_ID",
"clientSecret": "YOUR_SLACK_CLIENT_SECRET"
}
}
}
}
###### Accessibility tab
*Help context ID: 3288*
Menu: **View****®****Interface Properties****®****Accessibility**
Use the **Accessibility** tab to specify accessibility options.
###### Magnifier Magnification
*Help context ID: 3243*
Menu: **View****®****Interface Properties****®****Accessibility**
Changes the level of magnification when you use [](#t_inspectthepathdiagramundermagnification).
See [Inspect the path diagram under magnification](#t_inspectthepathdiagramundermagnification)
Programming
In Amos Graphics programs, you can select the first item in this ComboBox as follows (Visual Basic):
Dim aComboBox As Windows.Forms.ComboBox = Pd.GetComboBox("InterfacePropertiesForm", "LoupeCombo") aComboBox.SelectedIndex = 0
###### Focus Rectangle Thickness
*Help context ID: 3244*
Menu: **View****®****Interface Properties****®****Accessibility**
A focus rectangle is a visible rectangle in a window or dialog box. The focus rectangle encloses the portion of the window or dialog box that receives keystrokes that you enter at the keyboard.
Sometimes, Windows automatically draws a focus rectangle to show where your keystrokes are directed. When a focus rectangle would be a helpful cue and Windows does not draw one automatically, Amos draws a focus rectangle. For focus rectangles that Amos draws, you can control the thickness of the rectangle's border by specifying a value for **View****®****Interface Properties****®****Accessibility****®****Focus Rectangle Thickness**.
If you do not find the focus rectangles to be helpful, you can eliminate the ones that Amos draws by setting the focus rectangle thickness to zero.
###### Alternative to Color
*Help context ID: 3246*
Menu: **View****®****Interface Properties****®****Accessibility**
Provides an alternative visual cue in addition to color in certain cases where color is used as a distinctive feature. Placing a check mark here:
- displays optional arrows as "dotted" in specification searches.
- uses thick lines to draw color-highlighted objects in assisted multiple-group analyses.
Programming
In Amos Graphics programs, you can put a check mark in this check box by using the following statement (Visual Basic):
Pd.GetCheckBox("InterfacePropertiesForm", "chkColorAlternative").Checked = True
###### Syntax tab
Menu: **View****®****Interface Properties****®****Syntax**
The Syntax tab allows you to make choices about the user interface in the [Syntax view](#t_syntax-view).
###### Syntax highlighting
*Help context ID: 3228*
Menu: **View****®****Interface Properties****®****Syntax****®****Syntax highlighting**
You can use colors, fonts and borders to highlight parts of the text. The **Syntax highlighting** list box shows various categories of text that you might wish to highlight.
The categories of text that you can select from the **Syntax highlighting** list box are:
- [Latent variables](#t_latent-variables)
- [Unique variables](#t_unique-variables)
- [Observed variables](#t_observed-variables)
- [Parameters](#t_parameters)
- [Matching strings](#t_matching-strings)
- [Comments](#t_comments2)
###### Latent variables
To highlight latent variable names in Syntax view:
1. Select **Latent variables** in the **Syntax highlighting** list box.
2. Specify how you want to highlight latent variable names by clicking the following controls:
- [Foreground color](#t_color-check-box) (check box and button)
- [Background color](#t_backcolor-check-box) (check box and button)
- [Bold](#t_bold-check-box) (check box)
- [Italic](#t_italic-check-box) (check box)
- [Underline](#t_underline-check-box) (check box)
- [Border](#t_border-check-box) (check box)
You might notice a check box just to the left of **Latent variables** in the **Syntax highlighting** list box. You cannot directly add or remove a check mark there. Amos puts a check mark there when you have chosen to highlight latent variable names in some manner.
###### Unique variables
To highlight unique variable names in Syntax view:
1. Select **Unique variables** in the **Syntax highlighting** list box.
2. Specify how you want to highlight unique variable names by clicking the following controls:
- [Foreground color](#t_color-check-box) (check box and button)
- [Background color](#t_backcolor-check-box) (check box and button)
- [Bold](#t_bold-check-box) (check box)
- [Italic](#t_italic-check-box) (check box)
- [Underline](#t_underline-check-box) (check box)
- [Border](#t_border-check-box) (check box)
You might notice a check box just to the left of **Unique variables** in the **Syntax highlighting** list box. You cannot directly add or remove a check mark there. Amos puts a check mark there when you have chosen to highlight unique variable names in some manner.
###### Observed variables
To highlight observed variable names in Syntax view:
1. Select **Observed variables** in the **Syntax highlighting** list box.
2. Specify how you want to highlight observed variable names by clicking the following controls:
- [Foreground color](#t_color-check-box) (check box and button)
- [Background color](#t_backcolor-check-box) (check box and button)
- [Bold](#t_bold-check-box) (check box)
- [Italic](#t_italic-check-box) (check box)
- [Underline](#t_underline-check-box) (check box)
- [Border](#t_border-check-box) (check box)
You might notice a check box just to the left of **Observed variables** in the **Syntax highlighting** list box. You cannot directly add or remove a check mark there. Amos puts a check mark there when you have chosen to highlight observed variable names in some manner.
###### Parameters
To highlight parameter names in Syntax view:
1. Select **Parameters** in the **Syntax highlighting** list box.
2. Specify how you want to highlight parameter names by clicking the following controls:
- [Foreground color](#t_color-check-box) (check box and button)
- [Background color](#t_backcolor-check-box) (check box and button)
- [Bold](#t_bold-check-box) (check box)
- [Italic](#t_italic-check-box) (check box)
- [Underline](#t_underline-check-box) (check box)
- [Border](#t_border-check-box) (check box)
You might notice a check box just to the left of **Parameters** in the **Syntax highlighting** list box. You cannot directly add or remove a check mark there. Amos puts a check mark there when you have chosen to highlight parameter names in some manner.
###### Matching strings
You can choose to highlight all occurrences of a variable name or parameter name that is pointed to by the cursor1. Then, for example, if you click the variable name "verbal", so that the cursor moves to that variable name, all occurrences of "verbal" will be highlighted.
To highlight all occurrences of the name that the cursor is in:
1. Select **Matching strings** in the **Syntax highlighting** list box.
2. Specify how you want to highlight matching strings by clicking the following controls:
- [Foreground color](#t_color-check-box) (check box and button)
- [Background color](#t_backcolor-check-box) (check box and button)
- [Bold](#t_bold-check-box) (check box)
- [Italic](#t_italic-check-box) (check box)
- [Underline](#t_underline-check-box) (check box)
- [Border](#t_border-check-box) (check box)
You might notice a check box just to the left of **Matching strings** in the **Syntax highlighting** list box. You cannot directly add or remove a check mark there. Amos puts a check mark there when you have chosen to highlight matching strings in some manner.
1The "cursor" in Amos's syntax editor is the blinking vertical bar that shows the point in the text where characters you type at the keyboard will be inserted. You can move the cursor to a new location by clicking that location with the mouse or by using the arrow keys on the keyboard.
###### Comments
To highlight [comments](#t_comments) in Syntax view:
1. Select **Comments** in the **Syntax highlighting** list box.
2. Specify how you want to highlight comments by clicking the following controls:
- [Foreground color](#t_color-check-box) (check box and button)
- [Background color](#t_backcolor-check-box) (check box and button)
- [Bold](#t_bold-check-box) (check box)
- [Italic](#t_italic-check-box) (check box)
- [Underline](#t_underline-check-box) (check box)
- [Border](#t_border-check-box) (check box)
You might notice a check box just to the left of **Comments** in the **Syntax highlighting** list box. You cannot directly add or remove a check mark there. Amos puts a check mark there when you have chosen to highlight comments in some manner.
###### Foreground color (check box and button)
*Help context ID: 3245*
Menu: **View****®****Interface Properties****®****Syntax****®****Foreground color**
1. Put a check mark here to use a special color for the kind of text that is selected in the [Syntax highlighting](#t_strings-that-can-be-highlighte) list box.
2. Click the "..." button just to the left of the check box to choose that special color.
###### Background color (check box and button)
*Help context ID: 3250*
Menu: **View****®****Interface Properties****®****Syntax****®****Background color**
1. Put a check mark here to use a special background color for the kind of text that is selected in the [Syntax highlighting](#t_strings-that-can-be-highlighte) list box.
2. Click the "..." button just to the left of the check box to choose that special background color.
###### Bold (check box)
*Help context ID: 3260*
Menu: **View****®****Interface Properties****®****Syntax****®****Bold**
Put a check mark here to use a bold font for the kind of text that is selected in the [Syntax highlighting](#t_strings-that-can-be-highlighte) list box.
###### Italic (check box)
*Help context ID: 3262*
Menu: **View****®****Interface Properties****®****Syntax****®****Italic**
Put a check mark here to use an italic font for the kind of text that is selected in the [Syntax highlighting](#t_strings-that-can-be-highlighte) list box.
###### Underline (check box)
*Help context ID: 3263*
Menu: **View****®****Interface Properties****®****Syntax****®****Underline**
Put a check mark here to underline the kind of text that is selected in the [Syntax highlighting](#t_strings-that-can-be-highlighte) list box.
###### Border (check box)
*Help context ID: 3264*
Menu: **View****®****Interface Properties****®****Syntax****®****Border**
Put a check mark here to draw a border around the kind of text that is selected in the [Syntax highlighting](#t_strings-that-can-be-highlighte) list box.
###### Default colors
*Help context ID: 3229, 3230, 3237*
Menu: **View****®****Interface Properties****®****Syntax****®****Default colors**
Click these buttons to choose the colors used for text that is not [highlighted](#t_strings-that-can-be-highlighte).
###### Color themes
*Help context ID: 3238, 3239, 3240*
Menu: **View****®****Interface Properties****®****Syntax****®****Color themes**
A "color theme" consists of
- default foreground and background colors for text that is not highlighted
- foreground and background colors used for highlighting various categories of text. This includes colors used to highlight latent variables, colors used to highlight unique variables, and so on
Amos comes with two color themes called "Light" and "Dark". You can select one of them from the **Color themes** dropdown list.
You don't have to use the Light or Dark theme. You can choose your own [default](#t_default-colors) colors and [highlighting](#t_strings-that-can-be-highlighte) colors. Then if you find a combination of colors that you want to use again and again, you can make that combination of colors into a theme. To create a new color theme:
1. Look at the **Color themes** box. If the box contains a name, then it is the name of an existing color theme and you are currently using that color theme.
2. If the **Color themes** box is empty, then there is no existing color theme that matches your current colors. To create a color theme with your current colors, type a theme name in the **Color themes** box and click the **Add** button.
###### Syntax preferences
*Help context ID: 3265*
Menu: **View****®****Interface Properties****®****Syntax****®****Syntax preferences**
There is some flexibility in the way a model is specified in the Syntax view. Plus signs (+) and asterisks (\*) can be omitted in [regression equations](#t_regression-equations). The "<>" symbol can be omitted when specifying [covariances](#t_covariances). Empty parentheses can usually be omitted. When you are entering text by typing at the keyboard in the Syntax view, you can decide on a case by case basis whether to enter an optional "+" or "<>". However, if you specify a model in the Path Diagram view and then change to the Syntax view, Amos must generate text for the Syntax view. The Syntax preferences check boxes are used to tell Amos which optional text to include.
- Put a check mark next to "\*" to insert asterisks wherever possible.
- Put a check mark next to "+" to insert plus signs wherever possible.
- Put a check mark next to "<>" to insert the "<>" symbol wherever possible.
- Put a check mark next to "()" to insert empty parentheses wherever possible.
###### Stan tab
Menu: **View****®****Interface Properties****®****Stan**
The Stan tab allows you to specify options that affect [exporting a model to Stan](https://ai-docs.amosdevelopment.com/03-amos-graphics-reference-guide-part-2.md#t_export-to-stan).
###### Before exporting Stan files
*Help context ID: 4508*
Normally Amos exports Stan files to a default folder that Amos chooses. You may use [this option](#t_ask-where-to-save) to specify the folder for the exported Stan files.
###### Ask where to save
*Help context ID: 4501*
Menu: **View****®****Interface Properties****®****Stan**
Put a check mark here if you want Amos to ask you where to save the files it creates when exporting to Stan. Amos will ask you this question every time you export a model to Stan.
If you leave this check box unchecked, Amos will save the exported files in a subfolder of the folder that contains the model's amw file. For example, say the Amos model is in the file **c:\work\abc.amw**. Then the files that Amos creates when exporting the model to Stan will be saved in the folder **c:\work\stanexport_abc**.
###### After exporting Stan files
*Help context ID: 4509*
You can specify what to do with the exported Stan files after they are exported. There are four mutually exclusive options.
- [Open Windows File Explorer](#t_open-windows-file-explorer)
- [Open a command prompt](#t_open-a-command-prompt)
- [Open the CmdStan IDE](#t_open-the-amos-interface-to-cmd)
- [Open RStudio](#t_open-rstudio)
###### Open Windows File Explorer
*Help context ID: 4504*
Menu: **View****®****Interface Properties****®****Stan**
Select this option in order to open File Explorer to view the exported files each time you export a model to Stan. If, say, the model is in the file **Ex39.amw**, the exported files consist of
- **Ex39.stan** This is the Stan program that specifies your model. This file will be compiled and executed by whatever version of Stan you choose to use. Double-click this file to open Amos's [interface to CmdStan](https://ai-docs.amosdevelopment.com/03-amos-graphics-reference-guide-part-2.md#t_interface-to-cmdstan).
- **Ex39.Data.R** This is a data file in Stan format. It contains only those measured variables that appear in the model. It excludes any variables in the original data file that are not part of the model.
- **Ex39.cmd** Double-click this Windows batch file to perform a Stan analysis using CmdStan (provided that CmdStan is installed.)
- **Ex39.R** This is an R script for using the rstan R package for fitting the model. You can configure Windows File Explorer to open RStudio when you double-click this file (provided that RStudio and the rstan package are installed.)
These files are can be viewed in any text editor.
###### Open a command prompt
*Help context ID: 4507*
Menu: **View****®****Interface Properties****®****Stan**
Select this option in order to open a command prompt window each time you export a model to Stan. The command prompt window will open with the current working directory set to the directory that contains the files that Amos exported.
If, say, the model is in the file **Ex39.amw**, the exported files consist of
- **Ex39.stan** This is the Stan program that specifies your model. This file that will be compiled and executed by whatever version of Stan you use. Double-click this file to open Amos's [interface to CmdStan](https://ai-docs.amosdevelopment.com/03-amos-graphics-reference-guide-part-2.md#t_interface-to-cmdstan).
- **Ex39.Data.R** This is a data file in Stan format. It contains only those measured variables that appear in the model. It excludes any variables in the original data file that are not part of the model.
- **Ex39.cmd** Double-click this Windows batch file to perform a Stan analysis using CmdStan (provided that CmdStan is installed.)
- **Ex39.R** This is an R script for using the rstan R package for fitting the model. You can configure Windows File Explorer to open RStudio when you double-click this file (provided that RStudio and the rstan package are installed.)
These files are can be viewed in any text editor.
###### Open the CmdStan IDE
*Help context ID: 4502*
Menu: **View****®****Interface Properties****®****Stan**
Select this option if [CmdStan](https://mc-stan.org/users/interfaces/cmdstan) is installed and you want to open Amos's interface to CmdStan each time you export a model to Stan.
###### Open RStudio
*Help context ID: 4503*
Menu: **View****®****Interface Properties****®****Stan**
Select this option if [R](https://www.r-project.org/), [RStan](https://mc-stan.org/users/interfaces/rstan) and [RStudio](https://rstudio.com/) are installed and you want to open RStudio each time you export a model to Stan.
###### Location of CmdStan
*Help context ID: 4505*
Menu: **View****®****Interface Properties****®****Stan**
If [CmdStan](https://mc-stan.org/users/interfaces/cmdstan) is installed, enter the folder that contains the CmdStan files.
###### Location of RStudio
*Help context ID: 4506*
Menu: **View****®****Interface Properties****®****Stan**
If [RStudio](https://rstudio.com/) is installed, enter the folder that contains the RStudio files.
###### Versions tab
*Help context ID: 3272*
Menu: **View****®****Interface Properties****®****Versions**
This tab allows you to specify whether you want to add the current version of the model to the version history when you save it. Later on, you can view the entire [Version history](#t_version-history), and revert to any previous version in the version history.
###### Yes, add my model to the version history when I save it
*Help context ID: 3274*
Menu: **View****®****Interface Properties****®****Versions**
Add your model to the version history every time it is saved. Later on, you can view the entire [Version history](#t_version-history), and revert to any previous version in the version history.
###### No, do not add my model to the version history when I save it.
*Help context ID: 3275*
Menu: **View****®****Interface Properties****®****Versions**
Do not add your model to the version history when it is saved.
###### Ask each time I save the model.
*Help context ID: 3276*
Menu: **View****®****Interface Properties****®****Versions**
Each time you save the model, you will be asked whether you want to add the model to the version history. Later on, you can view the entire [Version history](#t_version-history), and revert to any previous version in the version history.
##### View analysis properties
*Help context ID: 88*
Menu: **View****®****Analysis Properties**...
Shortcut: **Ctrl-R**
The **Analysis Properties** dialog allows you to describe the analysis you want to perform.
[AnalysisPropertiesForm]
###### Estimation tab
*Help context ID: 3172*
Menu: **View****®****Analysis Properties****®****Estimation**
Use the **Estimation** tab to specify a discrepancy function, and to specify whether the saturated and/or independence models should be fitted to data with missing values in order to allow calculating familiar measures of fit.
###### Maximum likelihood
*Help context ID: 3001*
Menu: **View****®****Analysis Properties****®****Estimation****®****Maximum likelihood**
Specifies estimation by the method of maximum likelihood, minimizing (D1) together with (D2) in Appendix B.
For more information, see the [Ml](https://ai-docs.amosdevelopment.com/05-programming-with-amos-part-2.md#t_mlmethod) method of the **AmosEngine** class.
Programming
In Amos Graphics programs, you can select this option by using the following statement (Visual Basic):
Pd.GetRadioButton("AnalysisPropertiesForm", "OptionDiscrepancy_ML").Checked = True
###### Generalized least squares
*Help context ID: 3002*
Menu: **View****®****Analysis Properties****®****Estimation****®****Generalized least squares**
Specifies a generalized least squares solution, obtained by minimizing (D1) together with (D3) in Appendix B.
For more information, see the [Gls](https://ai-docs.amosdevelopment.com/05-programming-with-amos-part-2.md#t_glsmethod) method of the **AmosEngine** class.
Programming
In Amos Graphics programs, you can select this option by using the following statement (Visual Basic):
Pd.GetRadioButton("AnalysisPropertiesForm", "OptionDiscrepancy_GLS").Checked = True
###### Unweighted least squares
*Help context ID: 3003*
Menu: **View****®****Analysis Properties****®****Estimation****®****Unweighted least squares**
Specifies an unweighted least squares solution, obtained by minimizing (D1) together with (D6) in Appendix B.
For more information, see the [Uls](https://ai-docs.amosdevelopment.com/05-programming-with-amos-part-2.md#t_ulsmethod) method of the **AmosEngine** class.
Programming
In Amos Graphics programs, you can select this option by using the following statement (Visual Basic):
Pd.GetRadioButton("AnalysisPropertiesForm", "OptionDiscrepancy_ULS").Checked = True
###### Scale-free least squares
*Help context ID: 3004*
Menu: **View****®****Analysis Properties****®****Estimation****®****Scale-free least squares**
Specifies the 'scale free' least squares solution obtained by minimizing (D1) together with (D5) in Appendix B.
For more information, see the [Sls](https://ai-docs.amosdevelopment.com/05-programming-with-amos-part-2.md#t_slsmethod) method of the **AmosEngine** class.
Programming
In Amos Graphics programs, you can select this option by using the following statement (Visual Basic):
Pd.GetRadioButton("AnalysisPropertiesForm", "OptionDiscrepancy_SLS").Checked = True
###### Asymptotically distribution-free
*Help context ID: 3005*
Menu: **View****®****Analysis Properties****®****Estimation****®****Asymptotically distribution-free**
Specifies estimation by [Browne's (1982)](https://ai-docs.amosdevelopment.com/08-references.md#t_browne_1982) asymptotically distribution-free criterion, minimizing (D1) together with (D4) in Appendix B.
For more information, see the [Adf](https://ai-docs.amosdevelopment.com/04-programming-with-amos-part-1.md#t_adfmethod) method of the **AmosEngine** class.
Programming
In Amos Graphics programs, you can select this option by using the following statement (Visual Basic):
Pd.GetRadioButton("AnalysisPropertiesForm", "OptionDiscrepancy_ADF").Checked = True
###### Estimate means and intercepts
*Help context ID: 3006*
Menu: **View****®****Analysis Properties****®****Estimation****®****Estimate means and intercepts**
When **Estimate means and intercepts** is checked, means and intercepts are estimated, and you can constrain them. (See [To constrain parameters](https://ai-docs.amosdevelopment.com/03-amos-graphics-reference-guide-part-2.md#t_toconstrainparameters1).) If you leave **Estimate means and intercepts** unchecked, means and intercepts will not be estimated.
Programming
In Amos Graphics programs, you can put a check mark in this check box by using the following statement (Visual Basic):
Pd.GetCheckBox("AnalysisPropertiesForm", "MeansInterceptsCheck").Checked = True
###### Emulisrel6
*Help context ID: 3007*
Menu: **View****®****Analysis Properties****®****Estimation****®****Emulisrel6**
Substitutes (D1a) for (D1) in [Appendix B](https://ai-docs.amosdevelopment.com/07-appendices.md#t_appendixbdiscrepancyfunctions1).
For more information, see the [Emulisrel6](https://ai-docs.amosdevelopment.com/04-programming-with-amos-part-1.md#t_emulisrel6method) method of the **AmosEngine** class.
Programming
In Amos Graphics programs, you can put a check mark in this check box by using the following statement (Visual Basic):
Pd.GetCheckBox("AnalysisPropertiesForm", "EmulisrelCheck").Checked = True
###### Chicorrect
*Help context ID: 3008*
Menu: **View****®****Analysis Properties****®****Estimation****®****Chicorrect**
Specifies the value of the constant, *r*, in Appendix A. When this box is left blank, the value of *r* is taken to be the number of groups.
When means and intercepts are highly constrained model parameters, some consideration should be given to putting 0 (zero) in this box.
For more information, see the [Chicorrect](https://ai-docs.amosdevelopment.com/04-programming-with-amos-part-1.md#t_chicorrectmethod) method of the **AmosEngine** class.
Programming
In Amos Graphics programs, you can fill this text box with "2" by using the following statement (Visual Basic):
Pd.GetTextBox("AnalysisPropertiesForm", "ChicorrectText").Text = "2"
###### For the purpose of computing fit measures with incomplete data
*Help context ID: 3018*
Menu: **View****®****Analysis Properties****®****Estimation**
Specify whether to fit the saturated and/or independence models when there are missing values in the data.
###### Fit the saturated and independence models
*Help context ID: 3027*
Menu: **View****®****Analysis Properties****®****Estimation****®****Fit the saturated and independence models**
When there are missing values in the data, fit both the saturated and independence models. This option allows computing all the familiar fit measures.
Programming
In Amos Graphics programs, you can select this option by using the following statement (Visual Basic):
Pd.GetRadioButton("AnalysisPropertiesForm", "OptionIncompleteData_SatInd").Checked = True
###### Fit the saturated model only
*Help context ID: 3028*
Menu: **View****®****Analysis Properties****®****Estimation****®****Fit the saturated model only**
When there are missing values in the data, fit the saturated model, but not the independence model. This option allows computing the familiar chi-square statistic and fit measures that are functions of it.
Programming
In Amos Graphics programs, you can select this option by using the following statement (Visual Basic):
Pd.GetRadioButton("AnalysisPropertiesForm", "OptionIncompleteData_Sat").Checked = True
###### Fit neither model
*Help context ID: 3029*
Menu: **View****®****Analysis Properties****®****Estimation****®****Fit neither model**
Do not fit either the saturated or the independence model. With this option, it is not possible to compute any of the familiar fit measures.
Programming
In Amos Graphics programs, you can select this option by using the following statement (Visual Basic):
Pd.GetRadioButton("AnalysisPropertiesForm", "OptionIncompleteData_None").Checked = True
###### Numerical tab
*Help context ID: 3173*
Menu: **View****®****Analysis Properties****®****Numerical**
Use the **Numerical** tab to affect the algorithm used to minimize the discrepancy function.
###### Crit 1
*Help context ID: 3011*
Menu: **View****®****Analysis Properties****®****Numerical****®****Crit 1**
Affects one of the convergence criteria used in deciding whether a local minimum has been reached. Amos requires the absolute value of each first order derivative to be less than the value specified by Crit1 at the end of the final iteration.
For more information, see the [Crit1](https://ai-docs.amosdevelopment.com/04-programming-with-amos-part-1.md#t_crit1method) method of the **AmosEngine** class.
Programming
In Amos Graphics programs, you can fill this text box with "1E-05" by using the following statement (Visual Basic):
Pd.GetTextBox("AnalysisPropertiesForm", "Crit1Text").Text = "1E-05"
###### Crit 2
*Help context ID: 3012*
Menu: **View****®****Analysis Properties****®****Numerical****®****Crit 2**
Affects one of the convergence criteria used in deciding whether a local minimum has been reached. Amos requires that, on the final iteration, the distance traveled in the parameter space (the square root of the sum of squared changes in the parameter values) be less than the threshold specified by Crit2.
For more information, see the [Crit2](https://ai-docs.amosdevelopment.com/04-programming-with-amos-part-1.md#t_crit2method) method of the **AmosEngine** class.
Programming
In Amos Graphics programs, you can fill this text box with "0.001" by using the following statement (Visual Basic):
Pd.GetTextBox("AnalysisPropertiesForm", "Crit2Text").Text = "0.001"
###### Iteration limit
*Help context ID: 3013*
Menu: **View****®****Analysis Properties****®****Numerical****®****Iteration limit**
Places a limit on the number of iterations Amos will perform. If this limit is reached, Amos will stop after reporting its current parameter estimates, even if the convergence criteria (see the [Crit1](https://ai-docs.amosdevelopment.com/04-programming-with-amos-part-1.md#t_crit1method) and [Crit2](https://ai-docs.amosdevelopment.com/04-programming-with-amos-part-1.md#t_crit2method) methods) have not been met.
For more information, see the [Iterations](https://ai-docs.amosdevelopment.com/05-programming-with-amos-part-2.md#t_iterationsmethod) method of the **AmosEngine** class.
Programming
In Amos Graphics programs, you can fill this text box with "100" by using the following statement (Visual Basic):
Pd.GetTextBox("AnalysisPropertiesForm", "IterationText").Text = "100"
###### Number of Gauss-Newton iterations
*Help context ID: 3014*
Menu: **View****®****Analysis Properties****®****Numerical****®****Number of Gauss-Newton iterations**
Employs Fisher's scoring method in the case of maximum likelihood estimation ([Ml](https://ai-docs.amosdevelopment.com/05-programming-with-amos-part-2.md#t_mlmethod)), or the Gauss-Newton method in the case of least squares estimation ([Uls](https://ai-docs.amosdevelopment.com/05-programming-with-amos-part-2.md#t_ulsmethod), [Sls](https://ai-docs.amosdevelopment.com/05-programming-with-amos-part-2.md#t_slsmethod), [Gls](https://ai-docs.amosdevelopment.com/05-programming-with-amos-part-2.md#t_glsmethod) or [Adf](https://ai-docs.amosdevelopment.com/04-programming-with-amos-part-1.md#t_adfmethod)).
For more information, see the [Fisher](https://ai-docs.amosdevelopment.com/04-programming-with-amos-part-1.md#t_fishermethod) method of the **AmosEngine** class.
Programming
In Amos Graphics programs, you can fill this text box with "5" by using the following statement (Visual Basic):
Pd.GetTextBox("AnalysisPropertiesForm", "FisherText").Text = "5"
###### Allow non-positive definite sample covariance matrices
*Help context ID: 3015*
Menu: **View****®****Analysis Properties****®****Numerical****®****Allow non-positive definite sample covariance matrices**
Permits maximum likelihood estimation to be attempted even when a sample covariance matrix is not positive definite.
For more information, see the [NonPositive](https://ai-docs.amosdevelopment.com/05-programming-with-amos-part-2.md#t_nonpositivemethod) method of the **AmosEngine** class.
Programming
In Amos Graphics programs, you can put a check mark in this check box by using the following statement (Visual Basic):
Pd.GetCheckBox("AnalysisPropertiesForm", "NonPositiveCheck").Checked = True
###### Try to fit unidentified models
*Help context ID: 3016*
Menu: **View****®****Analysis Properties****®****Numerical****®****Try to fit unidentified models**
Permits estimation to be attempted even when a model appears to be unidentified
For more information, see the [AllowUnidentified](https://ai-docs.amosdevelopment.com/04-programming-with-amos-part-1.md#t_allowunidentifiedmethod) method of the **AmosEngine** class.
Programming
In Amos Graphics programs, you can put a check mark in this check box by using the following statement (Visual Basic):
Pd.GetCheckBox("AnalysisPropertiesForm", "UnidentifiedCheck").Checked = True
###### Bias tab
*Help context ID: 3174*
Menu: **View****®****Analysis Properties****®****Bias**
Use the **Bias** tab to specify whether sample covariances are biased or unbiased, and whether biased or unbiased covariances should be used in fitting the model.
###### Maximum likelihood input
*Help context ID: 3021*
Menu: **View****®****Analysis Properties****®****Bias****®****Covariances supplied as input****®****Maximum likelihood**
Specifies that any sample covariances that are read from a data file are (biased) maximum likelihood estimates of the corresponding population covariances.
For more information, see the [InputMLMoments](https://ai-docs.amosdevelopment.com/05-programming-with-amos-part-2.md#t_inputmlmomentsmethod) method of the **AmosEngine** class.
Programming
In Amos Graphics programs, you can select this option by using the following statement (Visual Basic):
Pd.GetRadioButton("AnalysisPropertiesForm", "OptionInputBias_ML").Checked = True
###### Unbiased input
*Help context ID: 3022*
Menu: **View****®****Analysis Properties****®****Bias****®****Covariances supplied as input****®****Unbiased**
Specifies that any sample covariances that are read from a data file are unbiased estimates of the corresponding population covariances.
For more information, see the [InputUnbiasedMoments](https://ai-docs.amosdevelopment.com/05-programming-with-amos-part-2.md#t_inputunbiasedmomentsmethod) method of the **AmosEngine** class.
Programming
In Amos Graphics programs, you can select this option by using the following statement (Visual Basic):
Pd.GetRadioButton("AnalysisPropertiesForm", "OptionInputBias_Unbiased").Checked = True
###### Analyze maximum likelihood
*Help context ID: 3023*
Menu: **View****®****Analysis Properties****®****Bias****®****Covariances to be analyzed****®****Maximum likelihood**
Fits the sample covariance matrix that is the maximum likelihood estimate (rather than the unbiased estimate).
For more information, see the [FitMLMoments](https://ai-docs.amosdevelopment.com/04-programming-with-amos-part-1.md#t_fitmlmomentsmethod) method of the **AmosEngine** class.
Programming
In Amos Graphics programs, you can select this option by using the following statement (Visual Basic):
Pd.GetRadioButton("AnalysisPropertiesForm", "OptionUseBias_ML").Checked = True
###### Analyze unbiased
*Help context ID: 3024*
Menu: **View****®****Analysis Properties****®****Bias****®****Covariances to be analyzed****®****Unbiased**
Fits the sample covariance matrix that is an unbiased estimate (rather than the maximum likelihood estimate).
For more information, see the [FitUnbiasedMoments](https://ai-docs.amosdevelopment.com/04-programming-with-amos-part-1.md#t_fitunbiasedmomentsmethod) method of the **AmosEngine** class.
Programming
In Amos Graphics programs, you can select this option by using the following statement (Visual Basic):
Pd.GetRadioButton("AnalysisPropertiesForm", "OptionUseBias_Unbiased").Checked = True
###### Output tab
*Help context ID: 3175*
Menu: **View****®****Analysis Properties****®****Output**
Use the **Output** tab to specify the output that you want.
###### Minimization history
*Help context ID: 3041*
Menu: **View****®****Analysis Properties****®****Output****®****Minimization history**
Displays a summary of the course of minimization of the discrepancy function.
For more information, see the [Technical](https://ai-docs.amosdevelopment.com/05-programming-with-amos-part-2.md#t_technicalmethod) method of the **AmosEngine** class.
Programming
In Amos Graphics programs, you can put a check mark in this check box by using the following statement (Visual Basic):
Pd.GetCheckBox("AnalysisPropertiesForm", "TechnicalCheck").Checked = True
###### Standardized estimates
*Help context ID: 3042*
Menu: **View****®****Analysis Properties****®****Output****®****Standardized estimates**
Displays standardized parameter estimates (correlations among exogenous variables, and standardized regression weights). When you have also checked **Sample moments**, checking **Standardized estimates** displays sample correlations. When you have checked **Implied moments** or **All implied moments**, it displays implied correlations. When you have checked **Indirect, direct & total effects**, it displays standardized indirect effects, direct effects and total effects.
For more information, see the [Standardized](https://ai-docs.amosdevelopment.com/05-programming-with-amos-part-2.md#t_standardizedmethod) method of the **AmosEngine** class.
Programming
In Amos Graphics programs, you can put a check mark in this check box by using the following statement (Visual Basic):
Pd.GetCheckBox("AnalysisPropertiesForm", "StandardizedCheck").Checked = True
###### Squared multiple correlations
*Help context ID: 3043*
Menu: **View****®****Analysis Properties****®****Output****®****Squared multiple correlations**
Displays the squared multiple correlation between each endogenous variable and the variables (other than residual variables) that directly affect it.
For more information, see the [Smc](https://ai-docs.amosdevelopment.com/05-programming-with-amos-part-2.md#t_smcmethod) method of the **AmosEngine** class.
Programming
In Amos Graphics programs, you can put a check mark in this check box by using the following statement (Visual Basic):
Pd.GetCheckBox("AnalysisPropertiesForm", "SmcCheck").Checked = True
###### Sample moments (Analysis Properties)
*Help context ID: 3044*
Menu: **View****®****Analysis Properties****®****Output****®****Sample moments**
Displays the sample covariance matrix and (if means and intercepts are explicitly modeled) the sample means.
For more information, see the [SampleMoments](https://ai-docs.amosdevelopment.com/05-programming-with-amos-part-2.md#t_samplemomentsmethod) method of the **AmosEngine** class.
Programming
In Amos Graphics programs, you can put a check mark in this check box by using the following statement (Visual Basic):
Pd.GetCheckBox("AnalysisPropertiesForm", "SampleMomCheck").Checked = True
###### Implied moments (Analysis Properties)
*Help context ID: 3045*
Menu: **View****®****Analysis Properties****®****Output****®****Implied moments**
Displays the implied covariance matrix for the observed variables. When means and intercepts are explicitly modeled, implied means are also displayed.
For more information, see the [ImpliedMoments](https://ai-docs.amosdevelopment.com/05-programming-with-amos-part-2.md#t_impliedmomentsmethod) method of the **AmosEngine** class.
Programming
In Amos Graphics programs, you can put a check mark in this check box by using the following statement (Visual Basic):
Pd.GetCheckBox("AnalysisPropertiesForm", "ImpliedMomCheck").Checked = True
###### All implied moments
*Help context ID: 3046*
Menu: **View****®****Analysis Properties****®****Output****®****All implied moments**
Displays the implied covariance matrix for all variables. When means and intercepts are explicitly modeled, implied means are also displayed.
For more information, see the [AllImpliedMoments](https://ai-docs.amosdevelopment.com/04-programming-with-amos-part-1.md#t_allimpliedmomentsmethod) method of the **AmosEngine** class.
Programming
In Amos Graphics programs, you can put a check mark in this check box by using the following statement (Visual Basic):
Pd.GetCheckBox("AnalysisPropertiesForm", "AllImpliedMomCheck").Checked = True
###### Residual moments
*Help context ID: 3047*
Menu: **View****®****Analysis Properties****®****Output****®****Residual moments**
Displays the difference between the sample covariance matrix and the implied covariance matrix. If means and intercepts are explicitly modeled, the differences between sample means and implied means are also displayed.
For more information, see the [ResidualMoments](https://ai-docs.amosdevelopment.com/05-programming-with-amos-part-2.md#t_residualmomentsmethod) method of the **AmosEngine** class.
Programming
In Amos Graphics programs, you can put a check mark in this check box by using the following statement (Visual Basic):
Pd.GetCheckBox("AnalysisPropertiesForm", "ResidualMomCheck").Checked = True
###### Modification indices
*Help context ID: 3055*
Menu: **View****®****Analysis Properties****®****Output****®****Modification indices**
Displays the modification indices described by [Jöreskog and Sörbom (1984)](https://ai-docs.amosdevelopment.com/08-references.md#t_joereskog__soerbom_1984).
For more information, see the [Mods](https://ai-docs.amosdevelopment.com/05-programming-with-amos-part-2.md#t_modsmethod) method of the **AmosEngine** class.
Programming
In Amos Graphics programs, you can put a check mark in this check box by using the following statement (Visual Basic):
Pd.GetCheckBox("AnalysisPropertiesForm", "ModsCheck").Checked = True
###### D-separation
*Help context ID: 3057*
Menu: **View****®****Analysis Properties****®****Output****®****D-separation**
Put a check mark here to include a [d-separation](https://ai-docs.amosdevelopment.com/03-amos-graphics-reference-guide-part-2.md#t_d-separation) analysis the next time you fit the model by clicking [Analyze→Calculate Estimates](#t_calculateestimates). The results of the d-separation analysis will appear along with all of the other results in the text output file that is displayed when you click [View→Text Output](#t_viewtextoutput).
###### Indirect, direct, & total effects
*Help context ID: 3048*
Menu: **View****®****Analysis Properties****®****Output****®****Indirect, direct, & total effects**
Displays direct, indirect and total effects.
For more information, see the [TotalEffects](https://ai-docs.amosdevelopment.com/05-programming-with-amos-part-2.md#t_totaleffectsmethod) method of the **AmosEngine** class.
Programming
In Amos Graphics programs, you can put a check mark in this check box by using the following statement (Visual Basic):
Pd.GetCheckBox("AnalysisPropertiesForm", "TotalEffectsCheck").Checked = True
###### Factor score weights
*Help context ID: 3049*
Menu: **View****®****Analysis Properties****®****Output****®****Factor score weights**
Displays regression weights for predicting the unobserved variables from the observed variables.
For more information, see the [FactorScoreWeights](https://ai-docs.amosdevelopment.com/04-programming-with-amos-part-1.md#t_factorscoreweightsmethod) method of the **AmosEngine** class.
Programming
In Amos Graphics programs, you can put a check mark in this check box by using the following statement (Visual Basic):
Pd.GetCheckBox("AnalysisPropertiesForm", "FactorScoresCheck").Checked = True
###### Covariances of estimates
*Help context ID: 3050*
Menu: **View****®****Analysis Properties****®****Output****®****Covariances of estimates**
Displays an estimate of the covariance matrix of the parameter estimates.
For more information, see the [Covest](https://ai-docs.amosdevelopment.com/04-programming-with-amos-part-1.md#t_covestmethod) method of the **AmosEngine** class.
Programming
In Amos Graphics programs, you can put a check mark in this check box by using the following statement (Visual Basic):
Pd.GetCheckBox("AnalysisPropertiesForm", "CovestCheck").Checked = True
###### Correlations of estimates
*Help context ID: 3051*
Menu: **View****®****Analysis Properties****®****Output****®****Correlations of estimates**
Displays an estimate of the correlation matrix of the parameter estimates.
For more information, see the [Corest](https://ai-docs.amosdevelopment.com/04-programming-with-amos-part-1.md#t_corestmethod) method of the **AmosEngine** class.
Programming
In Amos Graphics programs, you can put a check mark in this check box by using the following statement (Visual Basic):
Pd.GetCheckBox("AnalysisPropertiesForm", "CorestCheck").Checked = True
###### Critical ratios for differences
*Help context ID: 3052*
Menu: **View****®****Analysis Properties****®****Output****®****Critical ratios for differences**
Displays a 'critical ratio' for each pair of parameter estimates. The critical ratio for a pair of parameter estimates provides a test of the hypothesis that the two parameters are equal.
For more information, see the [Crdiff](https://ai-docs.amosdevelopment.com/04-programming-with-amos-part-1.md#t_crdiffmethod) method of the **AmosEngine** class.
Programming
In Amos Graphics programs, you can put a check mark in this check box by using the following statement (Visual Basic):
Pd.GetCheckBox("AnalysisPropertiesForm", "CrdiffCheck").Checked = True
###### Tests for normality and outliers
*Help context ID: 3053*
Menu: **View****®****Analysis Properties****®****Output****®****Tests for normality and outliers**
Displays statistics for assessing multivariate normality of the observed variables.
For more information, see the [NormalityCheck](https://ai-docs.amosdevelopment.com/05-programming-with-amos-part-2.md#t_normalitycheckmethod) method of the **AmosEngine** class.
Programming
In Amos Graphics programs, you can put a check mark in this check box by using the following statement (Visual Basic):
Pd.GetCheckBox("AnalysisPropertiesForm", "NormalityCheckCheck").Checked = True
###### Observed information matrix
*Help context ID: 3056*
Menu: **View****®****Analysis Properties****®****Output****®****Observed information matrix**
Place a check mark here to estimate the covariance matrix of estimates by inverting the matrix of exact second derivatives. When **Observed information matrix** is not checked, the covariance matrix of estimates is estimated by inverting the matrix of expected second derivatives. For more information, see the [ObservedInfo](https://ai-docs.amosdevelopment.com/05-programming-with-amos-part-2.md#t_observedinfomethod) method of the **AmosEngine** class.
Programming
In Amos Graphics programs, you can put a check mark in this check box by using the following statement (Visual Basic):
Pd.GetCheckBox("AnalysisPropertiesForm", "ObservedInfoCheck").Checked = True
###### Threshold for modification indices
*Help context ID: 3054*
Menu: **View****®****Analysis Properties****®****Output****®****Threshold for modification indices**
Specifies a threshold for the modification indices described by [Jöreskog and Sörbom (1984)](https://ai-docs.amosdevelopment.com/08-references.md#t_joereskog__soerbom_1984). Modification indices that exceed the threshold are displayed. (Modification indices are displayed only when the **Modification indices** checkbox is checked.)
For more information, see the [Mods](https://ai-docs.amosdevelopment.com/05-programming-with-amos-part-2.md#t_modsmethod) method of the **AmosEngine** class.
Programming
In Amos Graphics programs, you can fill this text box with "4" by using the following statement (Visual Basic):
Pd.GetTextBox("AnalysisPropertiesForm", "ModsText").Text = "4"
###### Bootstrap tab
*Help context ID: 3176*
Menu: **View****®****Analysis Properties****®****Bootstrap**
Use the **Bootstrap** tab to obtain bootstrap estimates of standard errors, confidence intervals and probability levels.
###### Perform bootstrap
*Help context ID: 3061*
Menu: **View****®****Analysis Properties****®****Bootstrap****®****Perform bootstrap**
Performs a bootstrap to obtain standard errors.
For more information, see the [Bootstrap](https://ai-docs.amosdevelopment.com/04-programming-with-amos-part-1.md#t_bootstrapmethod) method of the **AmosEngine** class.
Programming
In Amos Graphics programs, you can put a check mark in this check box by using the following statement (Visual Basic):
Pd.GetCheckBox("AnalysisPropertiesForm", "DoBootstrapCheck").Checked = True
###### Percentile confidence intervals
*Help context ID: 3062*
Menu: **View****®****Analysis Properties****®****Bootstrap****®****Percentile confidence intervals**
Obtains bootstrap confidence intervals by the percentile method ([Efron, 1987](https://ai-docs.amosdevelopment.com/08-references.md#t_efron_1987)).
For more information, see the [ConfidencePC](https://ai-docs.amosdevelopment.com/04-programming-with-amos-part-1.md#t_confidencepcmethod) method of the **AmosEngine** class.
Programming
In Amos Graphics programs, you can put a check mark in this check box by using the following statement (Visual Basic):
Pd.GetCheckBox("AnalysisPropertiesForm", "ConfidencePCCheck").Checked = True
###### Bias-corrected confidence intervals
*Help context ID: 3063*
Menu: **View****®****Analysis Properties****®****Bootstrap****®****Bias-corrected confidence intervals**
Obtains bias-corrected bootstrap confidence intervals ([Efron, 1987](https://ai-docs.amosdevelopment.com/08-references.md#t_efron_1987)).
For more information, see the [ConfidenceBC](https://ai-docs.amosdevelopment.com/04-programming-with-amos-part-1.md#t_confidencebcmethod) method of the **AmosEngine** class.
Programming
In Amos Graphics programs, you can put a check mark in this check box by using the following statement (Visual Basic):
Pd.GetCheckBox("AnalysisPropertiesForm", "ConfidenceBCCheck").Checked = True
###### Bootstrap ADF
*Help context ID: 3064*
Menu: **View****®****Analysis Properties****®****Bootstrap****®****Bootstrap ADF**
Displays a histogram of the discrepancies,
$C_{A D F}\left(\hat{\boldsymbol{\alpha}}_{1}, \mathbf{a}\right), C_{A D F}\left(\hat{\boldsymbol{\alpha}}_{2}, \mathbf{a}\right)_{z} \ldots, C_{A D F}\left(\hat{\boldsymbol{\alpha}}_{B}, \mathbf{a}\right)$,
where a is the vector of sample moments, *B* is the number of bootstrap samples and $\hat{\boldsymbol{\alpha}}_{b}$ is the vector of implied moments obtained by fitting the model to the *b*-th bootstrap sample. The mean and standard deviation of the distribution are also reported.
For more information, see the [BootAdf](https://ai-docs.amosdevelopment.com/04-programming-with-amos-part-1.md#t_bootadfmethod) method of the **AmosEngine** class.
Programming
In Amos Graphics programs, you can put a check mark in this check box by using the following statement (Visual Basic):
Pd.GetCheckBox("AnalysisPropertiesForm", "BootADFCheck").Checked = True
###### Bootstrap ML
*Help context ID: 3065*
Menu: **View****®****Analysis Properties****®****Bootstrap****®****Bootstrap ML**
Displays a histogram of the discrepancies,
$C_{K L}\left(\hat{\boldsymbol{a}}_{b}, \mathbf{a}_{b}\right)-C_{K L}(\mathbf{a}, \mathbf{a}), \quad b=1, \ldots, B$,
where a is the vector of sample moments, *B* is the number of bootstrap samples and $\hat{\boldsymbol{\alpha}}_{b}$ is the vector of implied moments obtained by fitting the model to the *b*-th bootstrap sample. The mean and standard deviation of the distribution are also reported.
For more information, see the [BootMl](https://ai-docs.amosdevelopment.com/04-programming-with-amos-part-1.md#t_bootmlmethod) method of the **AmosEngine** class.
Programming
In Amos Graphics programs, you can put a check mark in this check box by using the following statement (Visual Basic):
Pd.GetCheckBox("AnalysisPropertiesForm", "BootMLCheck").Checked = True
###### Bootstrap GLS
*Help context ID: 3066*
Menu: **View****®****Analysis Properties****®****Bootstrap****®****Bootstrap GLS**
Displays a histogram of the discrepancies,
$C_{G L S}\left(\hat{\boldsymbol{\alpha}}_{1}, \mathbf{a}\right), C_{G L S}\left(\hat{\boldsymbol{\alpha}}_{2}, \mathbf{a}\right), \ldots, C_{G L S}\left(\hat{\boldsymbol{\alpha}}_{B}, \mathbf{a}\right)$,
where a is the vector of sample moments, *B* is the number of bootstrap samples and $\hat{\boldsymbol{\alpha}}_{b}$ is the vector of implied moments obtained by fitting the model to the *b*-th bootstrap sample. The mean and standard deviation of the distribution are also reported.
For more information, see the [BootGls](https://ai-docs.amosdevelopment.com/04-programming-with-amos-part-1.md#t_bootglsmethod) method of the **AmosEngine** class.
Programming
In Amos Graphics programs, you can put a check mark in this check box by using the following statement (Visual Basic):
Pd.GetCheckBox("AnalysisPropertiesForm", "BootGLSCheck").Checked = True
###### Bootstrap SLS
*Help context ID: 3067*
Menu: **View****®****Analysis Properties****®****Bootstrap****®****Bootstrap SLS**
Displays a histogram of the discrepancies,
$C_{S L S}\left(\hat{\boldsymbol{\alpha}}_{1}, \mathbf{a}\right), C_{S L S}\left(\hat{\boldsymbol{\alpha}}_{2}, \mathbf{a}\right), \ldots, C_{S L S}\left(\hat{\boldsymbol{\alpha}}_{B}, \mathbf{a}\right)$,
where a is the vector of sample moments, *B* is the number of bootstrap samples and $\hat{\boldsymbol{\alpha}}_{b}$ is the vector of implied moments obtained by fitting the model to the *b*-th bootstrap sample. The mean and standard deviation of the distribution are also reported.
For more information, see the [BootSls](https://ai-docs.amosdevelopment.com/04-programming-with-amos-part-1.md#t_bootslsmethod) method of the **AmosEngine** class.
Programming
In Amos Graphics programs, you can put a check mark in this check box by using the following statement (Visual Basic):
Pd.GetCheckBox("AnalysisPropertiesForm", "BootSLSCheck").Checked = True
###### Bootstrap ULS
*Help context ID: 3068*
Menu: **View****®****Analysis Properties****®****Bootstrap****®****Bootstrap ULS**
Displays a histogram of the discrepancies,
$C_{U L S}\left(\hat{\boldsymbol{\alpha}}_{1}, \mathbf{a}\right), C_{U L S}\left(\hat{\boldsymbol{\alpha}}_{2}, \mathbf{a}\right), \ldots, C_{U L S}\left(\hat{\boldsymbol{\alpha}}_{B}, \mathbf{a}\right)$,
where
- a is the vector of sample moments,
- *B* is the number of bootstrap samples, and
- $\hat{\boldsymbol{\alpha}}_{b}$ is the vector of implied moments obtained by fitting the model to the *b*-th bootstrap sample.
The mean and standard deviation of the distribution are also reported.
For more information, see the [BootUls](https://ai-docs.amosdevelopment.com/04-programming-with-amos-part-1.md#t_bootulsmethod) method of the **AmosEngine** class.
Programming
In Amos Graphics programs, you can put a check mark in this check box by using the following statement (Visual Basic):
Pd.GetCheckBox("AnalysisPropertiesForm", "BootULSCheck").Checked = True
###### Number of bootstrap samples
*Help context ID: 3069*
Menu: **View****®****Analysis Properties****®****Bootstrap****®****Number of bootstrap samples**
The number of bootstrap samples.
For more information, see the [Bootstrap](https://ai-docs.amosdevelopment.com/04-programming-with-amos-part-1.md#t_bootstrapmethod) method of the **AmosEngine** class.
Programming
In Amos Graphics programs, you can fill this text box with "2000" by using the following statement (Visual Basic):
Pd.GetTextBox("AnalysisPropertiesForm", "BootstrapText").Text = "2000"
###### PC confidence level
*Help context ID: 3070*
Menu: **View****®****Analysis Properties****®****Bootstrap****®****PC confidence level**
Confidence level for confidence intervals obtained by the percentile method.
For more information, see the [ConfidencePC](https://ai-docs.amosdevelopment.com/04-programming-with-amos-part-1.md#t_confidencepcmethod) method of the **AmosEngine** class.
Programming
In Amos Graphics programs, you can fill this text box with "95" by using the following statement (Visual Basic):
Pd.GetTextBox("AnalysisPropertiesForm", "ConfidencePCText").Text = "95"
###### BC confidence level
*Help context ID: 3071*
Menu: **View****®****Analysis Properties****®****Bootstrap****®****BC confidence level**
Confidence level for bias corrected confidence intervals.
For more information, see the [ConfidenceBC](https://ai-docs.amosdevelopment.com/04-programming-with-amos-part-1.md#t_confidencebcmethod) method of the **AmosEngine** class.
Programming
In Amos Graphics programs, you can fill this text box with "95" by using the following statement (Visual Basic):
Pd.GetTextBox("AnalysisPropertiesForm", "ConfidenceBCText").Text = "95"
###### Monte Carlo (parametric bootstrap)
*Help context ID: 3072*
Menu: **View****®****Analysis Properties****®****Bootstrap****®****Monte Carlo (parametric bootstrap)**
When this box is checked, parametric bootstraps ([Efron and Tibshirani, 1993](https://ai-docs.amosdevelopment.com/08-references.md#t_efron__tibshirani_1993)) are performed. Bootstrap samples are drawn from a multivariate normal population whose means, variances and covariances are the same as the sample means, variances and covariances.
For more information, see the [MonteCarlo](https://ai-docs.amosdevelopment.com/05-programming-with-amos-part-2.md#t_montecarlomethod) method of the **AmosEngine** class.
Programming
In Amos Graphics programs, you can put a check mark in this check box by using the following statement (Visual Basic):
Pd.GetCheckBox("AnalysisPropertiesForm", "BootNormalCheck").Checked = True
###### Report details of each bootstrap sample
*Help context ID: 3073*
Menu: **View****®****Analysis Properties****®****Bootstrap****®****Report details of each bootstrap sample**
Displays detailed information about individual bootstrap samples.
For more information, see the [BootVerify](https://ai-docs.amosdevelopment.com/04-programming-with-amos-part-1.md#t_bootverifymethod) method of the **AmosEngine** class.
Programming
In Amos Graphics programs, you can put a check mark in this check box by using the following statement (Visual Basic):
Pd.GetCheckBox("AnalysisPropertiesForm", "BootVerifyCheck").Checked = True
###### Bollen-Stine bootstrap
*Help context ID: 3074*
Menu: **View****®****Analysis Properties****®****Bootstrap****®****Bollen-Stine bootstrap**
Carries out the bootstrap procedure of [Bollen and Stine (1992)](https://ai-docs.amosdevelopment.com/08-references.md#t_bollen__stine_1992) for testing the hypothesis that the specified model is correct.
For more information, see the [BootBS](https://ai-docs.amosdevelopment.com/04-programming-with-amos-part-1.md#t_bootbsmethod) method of the **AmosEngine** class.
Programming
In Amos Graphics programs, you can put a check mark in this check box by using the following statement (Visual Basic):
Pd.GetCheckBox("AnalysisPropertiesForm", "BootBSCheck").Checked = True
###### Bootfactor
*Help context ID: 3075*
Menu: **View****®****Analysis Properties****®****Bootstrap****®****Bootfactor**
Speeds up the bootstrap algorithm and makes it more reliable under the assumption that standard errors are inversely proportional to the square root of sample size.
For more information, see the [BootFactor](https://ai-docs.amosdevelopment.com/04-programming-with-amos-part-1.md#t_bootfactormethod) method of the **AmosEngine** class.
Programming
In Amos Graphics programs, you can fill this text box with "5" by using the following statement (Visual Basic):
Pd.GetTextBox("AnalysisPropertiesForm", "BootFactorText").Text = "5"
###### Permutations tab
*Help context ID: 3177*
Menu: **View****®****Analysis Properties****®****Permutations**
Use the **Permutations** tab to perform a permutations test ([Arbuckle, 1994b](https://ai-docs.amosdevelopment.com/08-references.md#t_arbuckle_1994b)). For more information about permutations tests, see the [Permute](https://ai-docs.amosdevelopment.com/05-programming-with-amos-part-2.md#t_permutemethod) method of the **AmosEngine** class.
###### Perform permutations test
*Help context ID: 3081*
Menu: **View****®****Analysis Properties****®****Permutations****®****Perform permutations test**
Place a check mark here to perform a permutation test. For more information, see the [Permute](https://ai-docs.amosdevelopment.com/05-programming-with-amos-part-2.md#t_permutemethod) method of the **AmosEngine** class.
Programming
In Amos Graphics programs, you can put a check mark in this check box by using the following statement (Visual Basic):
Pd.GetCheckBox("AnalysisPropertiesForm", "DoPermuteCheck").Checked = True
###### Report details
*Help context ID: 3082*
Menu: **View****®****Analysis Properties****®****Permutations****®****Report details**
Gives detailed information about the solution obtained for each permutation when the [Permute](https://ai-docs.amosdevelopment.com/05-programming-with-amos-part-2.md#t_permutemethod) method is used. First the permutation itself is reported. (That is, the new location of each observed variable in the model is shown after the permutation is carried out.) Then, if a solution is found, the value of the discrepancy function is reported along with a notation of whether the solution was admissible and whether the resulting linear system was stable.
For more information, see the [PermuteDetail](https://ai-docs.amosdevelopment.com/05-programming-with-amos-part-2.md#t_permutedetailmethod) method of the **AmosEngine** class.
Programming
In Amos Graphics programs, you can put a check mark in this check box by using the following statement (Visual Basic):
Pd.GetCheckBox("AnalysisPropertiesForm", "PermuteDetailCheck").Checked = True
###### All permutations
*Help context ID: 3083*
Menu: **View****®****Analysis Properties****®****Permutations****®****All permutations**
When this option is selected, any permutation tests that are performed are based on all permutations of the observed variables.
For more information, see the [Permute](https://ai-docs.amosdevelopment.com/05-programming-with-amos-part-2.md#t_permutemethod) method of the AmosEngine class.
Programming
In Amos Graphics programs, you can select this option by using the following statement (Visual Basic):
Pd.GetRadioButton("AnalysisPropertiesForm", "OptionPermute_All").Checked = True
###### Random permutations
*Help context ID: 3084*
Menu: **View****®****Analysis Properties****®****Permutations****®****Random permutations**
When this option is selected, any permutation tests that are performed are based on random permutations.
For more information, see the [Permute](https://ai-docs.amosdevelopment.com/05-programming-with-amos-part-2.md#t_permutemethod) method of the **AmosEngine** class.
Programming
In Amos Graphics programs, you can select this option by using the following statement (Visual Basic):
Pd.GetRadioButton("AnalysisPropertiesForm", "OptionPermute_Random").Checked = True
###### Number of random permutations
*Help context ID: 3085*
Menu: **View****®****Analysis Properties****®****Permutations****®****Number of random permutations**
The number of random permutations to obtain when a permutations tests is performed and the **Random permutations** option is selected.
For more information, see the [Permute](https://ai-docs.amosdevelopment.com/05-programming-with-amos-part-2.md#t_permutemethod) method of the **AmosEngine** class.
Programming
In Amos Graphics programs, you can fill this text box with "500" by using the following statement (Visual Basic):
Pd.GetTextBox("AnalysisPropertiesForm", "PermuteText").Text = "500"
###### Random Number tab
*Help context ID: 3178*
Menu: **View****®****Analysis Properties****®****Random #**
Use the **Random Number** tab to select a random number generator and to specify a seed for the Wichman-Hill ([Wichman & Hill, 1982](https://ai-docs.amosdevelopment.com/08-references.md#t_wichman__hill_1982)) random number generator. (Note that the Wichman-Hill random number generator is used only for the bootstrap and for permutations tests. See[ Random number generation ](https://ai-docs.amosdevelopment.com/03-amos-graphics-reference-guide-part-2.md#t_randomnumbergeneration1).)
###### Seed for random numbers
*Help context ID: 3091*
Menu: **View****®****Analysis Properties****®****Random #****®****Seed for random numbers**
Specifies a seed for the Wichman-Hill ([Wichman & Hill, 1982](https://ai-docs.amosdevelopment.com/08-references.md#t_wichman__hill_1982)) random number generator that is used for bootstrapping and for the permutation test. Using Amos twice with the same seed guarantees getting the same sequence of random numbers both times.
For more information, see the [Seed](https://ai-docs.amosdevelopment.com/05-programming-with-amos-part-2.md#t_seedmethod) method of the **AmosEngine** class.
Programming
In Amos Graphics programs, you can fill this text box with "999" by using the following statement (Visual Basic):
Pd.GetTextBox("AnalysisPropertiesForm", "SeedText").Text = "999"
###### Use original random number generator
*Help context ID: 3092*
Menu: **View****®****Analysis Properties****®****Random #****®****Use original random number generator**
Specifies use of a special random number generator that is common to all versions of Amos (since the beginning of time).
For more information, see the [Specran](https://ai-docs.amosdevelopment.com/05-programming-with-amos-part-2.md#t_specranmethod) method of the **AmosEngine** class.
Programming
In Amos Graphics programs, you can put a check mark in this check box by using the following statement (Visual Basic):
Pd.GetCheckBox("AnalysisPropertiesForm", "SpecranCheck").Checked = True
###### Title tab
*Help context ID: 3179*
Menu: **View****®****Analysis Properties****®****Title**
Use the **Title** tab to enter a title and description for this analysis.
###### Title and description of analysis
*Help context ID: 3093*
Menu: **View****®****Analysis Properties****®****Title****®****Title and description of analysis**
A title and description for this analysis.
Programming
In Amos Graphics programs, you can fill this text box with "Sample text" by using the following statement (Visual Basic):
Pd.GetTextBox("AnalysisPropertiesForm", "DescribeText").Text = "Sample text"
##### View object properties
*Help context ID: 85*
Menu: **View****®****Object Properties...**
Shortcut: **Ctrl-O**
The **Object Properties** dialog allows you to change the properties of objects (rectangles, ellipses, arrows and figure captions) in a path diagram.
[ObjectPropertiesForm]
###### Text tab
*Help context ID: 3355*
Menu: **View****®****Object Properties****®****Text**
Use the **Text** tab to enter variable names and figure captions, and to specify font characteristics for displaying them.
###### Font size (names and captions)
*Help context ID: 3371*
Menu: **View****®****Object Properties****®****Text****®****Font size**
If the currently selected object is a variable, this is the size of the font used to display its name.
(See [To change the font for a variable name](https://ai-docs.amosdevelopment.com/03-amos-graphics-reference-guide-part-2.md#t_tochangethefontforavariablename1).)
If the currently selected object is a figure caption, this is the size of the font used to display the caption.
(See [To change the font for a figure caption](https://ai-docs.amosdevelopment.com/03-amos-graphics-reference-guide-part-2.md#t_tochangethefontforafigurecaption1).)
**Programming**
In Amos Graphics programs, you can select the first item in this ComboBox as follows (Visual Basic):
Dim aComboBox As Windows.Forms.ComboBox = Pd.GetComboBox("", "VariableSizeCombo")
aComboBox.SelectedIndex = 0
###### Font style (names and captions)
*Help context ID: 3372*
Menu: **View****®****Object Properties****®****Text****®****Font style**
If the currently selected object is a variable, this is the font style used for its name.
(See [To change the font for a variable name](https://ai-docs.amosdevelopment.com/03-amos-graphics-reference-guide-part-2.md#t_tochangethefontforavariablename1).)
If the currently selected object is a figure caption, this is its font style.
(See [To change the font for a figure caption](https://ai-docs.amosdevelopment.com/03-amos-graphics-reference-guide-part-2.md#t_tochangethefontforafigurecaption1).)
**Programming**
In Amos Graphics programs, you can select the first item in this ComboBox as follows (Visual Basic):
Dim aComboBox As Windows.Forms.ComboBox = Pd.GetComboBox("", "VariableStyleCombo")
aComboBox.SelectedIndex = 0
###### Variable name
*Help context ID: 3373*
Menu: **View****®****Object Properties****®****Text****®****Variable name**
The name of the currently selected variable. Changes made in this box are reflected immediately in the path diagram.
**Programming**
In Amos Graphics programs, you can fill this text box with "SampleText" by using the following statement (Visual Basic):
Pd.GetTextBox("ObjectPropertiesForm", "VariableText_0").Text = "SampleText"
###### Variable label
*Help context ID: 3374*
Menu: **View****®****Object Properties****®****Text****®****Variable label**
A label associated with the currently selected variable. A variable's label can be different from its name. If a variable has a label, its label appears on the path diagram. If a variable has no label, its name appears on the path diagram. Changes made in this box are reflected immediately in the path diagram.
**Programming**
In Amos Graphics programs, you can fill this text box with "Sample text" by using the following statement (Visual Basic):
Pd.GetTextBox("ObjectPropertiesForm", "VariableText_1").Text = "Sample text"
###### Figure caption
*Help context ID: 3394*
Menu: **View****®****Object Properties****®****Text****®****Figure caption**
The currently selected figure caption. Changes made in this box are reflected immediately in the path diagram. You can use [text macros](#t_textmacros1) within a caption to display fit measures and other information such as the current date and time.
**Programming**
In Amos Graphics programs, you can fill this text box with "Sample text" by using the following statement (Visual Basic):
Pd.GetTextBox("ObjectPropertiesForm", "VariableText_0").Text = "Sample text"
###### Alignment
*Help context ID: 3393*
Menu: **View****®****Object Properties****®****Text****®****Alignment**
Specify how to align (justify) the individual lines of a multi-line figure caption.
- **Center align**: Line up the centers of the lines.
- **Left align**: Left-justify the lines.
- **Right align**: Right-justify the lines.
- **Center on page**: Center each line horizontally on the page.
[comboTitlePosition]
###### Parameters tab
*Help context ID: 3356*
Menu: **View****®****Object Properties****®****Parameters**
Use the **Parameters** tab to enter parameter names and parameter values, and to specify font characteristics for displaying them.
###### Font size (parameter values)
*Help context ID: 3381*
Menu: **View****®****Object Properties****®****Parameters****®****Font size**
The size of the font used to display parameter values for the currently selected object.
See also:
[To change the font for a parameter](https://ai-docs.amosdevelopment.com/03-amos-graphics-reference-guide-part-2.md#t_tochangethefontforaparameter1)
**Programming**
In Amos Graphics programs, you can select the first item in this ComboBox as follows (Visual Basic):
Dim aComboBox As Windows.Forms.ComboBox = Pd.GetComboBox("", "ParameterSizeCombo")
aComboBox.SelectedIndex = 0
###### Font style (parameter values)
*Help context ID: 3382*
Menu: **View****®****Object Properties****®****Parameters****®****Font style**
The font style used to display parameter values for the currently selected object.
See also:
[To change the font for a parameter](https://ai-docs.amosdevelopment.com/03-amos-graphics-reference-guide-part-2.md#t_tochangethefontforaparameter1)
**Programming**
In Amos Graphics programs, you can select the first item in this ComboBox as follows (Visual Basic):
Dim aComboBox As Windows.Forms.ComboBox = Pd.GetComboBox("", "ParameterStyleCombo")
aComboBox.SelectedIndex = 0
###### Orientation (of parameters)
*Help context ID: 3383*
Menu: **View****®****Object Properties****®****Parameters****®****Orientation**
Affects the appearance of parameters. The available choices are:
**Horizontal**, for example,
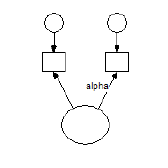.
**Oblique****, **for example,
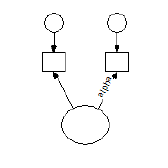**.**
**Oblique, inverted**, for example,
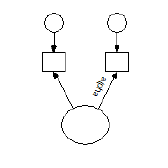.
See also:
[To change the font for a parameter](https://ai-docs.amosdevelopment.com/03-amos-graphics-reference-guide-part-2.md#t_tochangethefontforaparameter1)
**Programming**
In Amos Graphics programs, you can select the first item in this ComboBox as follows (Visual Basic):
Dim aComboBox As Windows.Forms.ComboBox = Pd.GetComboBox("", "ParameterOrientationCombo")
aComboBox.SelectedIndex = 0
###### Mean
*Help context ID: 3384*
Menu: **View****®****Object Properties****®****Parameters****®****Mean**
A name or value for the mean of the currently selected exogenous variable.
To learn how to choose a name or value, see
[To constrain parameters](https://ai-docs.amosdevelopment.com/03-amos-graphics-reference-guide-part-2.md#t_toconstrainparameters1)
[To set a parameter equal to a constant](https://ai-docs.amosdevelopment.com/03-amos-graphics-reference-guide-part-2.md#t_tosetaparameterequaltoaconstant1)
[To set parameters equal to each other](https://ai-docs.amosdevelopment.com/03-amos-graphics-reference-guide-part-2.md#t_tosetparametersequaltoeachother1)
[To provide initial values for parameters](https://ai-docs.amosdevelopment.com/03-amos-graphics-reference-guide-part-2.md#t_toprovideinitialvaluesforparameters1)
**Programming**
In Amos Graphics programs, you can fill this text box with "SampleText" by using the following statement (Visual Basic):
Pd.GetTextBox("ObjectPropertiesForm", "ParameterText1").Text = "SampleText"
###### Intercept
*Help context ID: 3397*
Menu: **View****®****Object Properties****®****Parameters****®****Intercept**
A name or value for the intercept in the regression equation used to predict the currently selected endogenous variable.
To learn how to choose a name or value, see
[To constrain parameters](https://ai-docs.amosdevelopment.com/03-amos-graphics-reference-guide-part-2.md#t_toconstrainparameters1)
[To set a parameter equal to a constant](https://ai-docs.amosdevelopment.com/03-amos-graphics-reference-guide-part-2.md#t_tosetaparameterequaltoaconstant1)
[To set parameters equal to each other](https://ai-docs.amosdevelopment.com/03-amos-graphics-reference-guide-part-2.md#t_tosetparametersequaltoeachother1)
[To provide initial values for parameters](https://ai-docs.amosdevelopment.com/03-amos-graphics-reference-guide-part-2.md#t_toprovideinitialvaluesforparameters1)
**Programming**
In Amos Graphics programs, you can fill this text box with "SampleText" by using the following statement (Visual Basic):
Pd.GetTextBox("ObjectPropertiesForm", "ParameterText1").Text = "SampleText"
###### Variance
*Help context ID: 3385*
Menu: **View****®****Object Properties****®****Parameters****®****Variance**
A name or value for the variance of the currently selected exogenous variable.
To learn how to choose a name or value, see
[To constrain parameters](https://ai-docs.amosdevelopment.com/03-amos-graphics-reference-guide-part-2.md#t_toconstrainparameters1)
[To set a parameter equal to a constant](https://ai-docs.amosdevelopment.com/03-amos-graphics-reference-guide-part-2.md#t_tosetaparameterequaltoaconstant1)
[To set parameters equal to each other](https://ai-docs.amosdevelopment.com/03-amos-graphics-reference-guide-part-2.md#t_tosetparametersequaltoeachother1)
[To provide initial values for parameters](https://ai-docs.amosdevelopment.com/03-amos-graphics-reference-guide-part-2.md#t_toprovideinitialvaluesforparameters1)
**Programming**
In Amos Graphics programs, you can fill this text box with "SampleText" by using the following statement (Visual Basic):
Pd.GetTextBox("ObjectPropertiesForm", "ParameterText2").Text = "SampleText"
###### Regression weight
*Help context ID: 3395*
Menu: **View****®****Object Properties****®****Parameters****®****Regression weight**
A name or value for the currently selected regression weight.
To learn how to choose a name or value, see
[To constrain parameters](https://ai-docs.amosdevelopment.com/03-amos-graphics-reference-guide-part-2.md#t_toconstrainparameters1)
[To set a parameter equal to a constant](https://ai-docs.amosdevelopment.com/03-amos-graphics-reference-guide-part-2.md#t_tosetaparameterequaltoaconstant1)
[To set parameters equal to each other](https://ai-docs.amosdevelopment.com/03-amos-graphics-reference-guide-part-2.md#t_tosetparametersequaltoeachother1)
[To provide initial values for parameters](https://ai-docs.amosdevelopment.com/03-amos-graphics-reference-guide-part-2.md#t_toprovideinitialvaluesforparameters1)
**Programming**
In Amos Graphics programs, you can fill this text box with "SampleText" by using the following statement (Visual Basic):
Pd.GetTextBox("ObjectPropertiesForm", "ParameterText2").Text = "SampleText"
###### Covariance
*Help context ID: 3396*
Menu: **View****®****Object Properties****®****Parameters****®****Covariance**
A name or value for the currently selected covariance.
To learn how to choose a name or value, see
[To constrain parameters](https://ai-docs.amosdevelopment.com/03-amos-graphics-reference-guide-part-2.md#t_toconstrainparameters1)
[To set a parameter equal to a constant](https://ai-docs.amosdevelopment.com/03-amos-graphics-reference-guide-part-2.md#t_tosetaparameterequaltoaconstant1)
[To set parameters equal to each other](https://ai-docs.amosdevelopment.com/03-amos-graphics-reference-guide-part-2.md#t_tosetparametersequaltoeachother1)
[To provide initial values for parameters](https://ai-docs.amosdevelopment.com/03-amos-graphics-reference-guide-part-2.md#t_toprovideinitialvaluesforparameters1)
[ParameterText2]
###### All groups
*Help context ID: 3386*
Menu: **View****®****Object Properties****®****Parameters****®****All groups**
When **All groups** is checked for a parameter, the parameter has the same name, or the same value, in all groups. Changing a parameter's name or value in one group affects all groups.
[AllGroupsCheck]
###### Colors tab (Object Properties dialog)
*Help context ID: 3354*
Menu: **View****®****Object Properties****®****Colors**
Use the **Colors** tab to specify colors used to draw the path diagram.
###### Text color
*Help context ID: 3361*
Menu: **View****®****Object Properties****®****Colors****®****Text color**
Color of variable names and figure captions. Click on the color sample to choose another color.
See also:
[To change an object's colors](https://ai-docs.amosdevelopment.com/03-amos-graphics-reference-guide-part-2.md#t_tochangeanobjectscolors)
[LabelATextColor]
###### Parameter color
*Help context ID: 3362*
Menu: **View****®****Object Properties****®****Colors****®****Parameter color**
Color of parameter names and parameter values. Click on the color sample to choose another color.
See also:
[To change an object's colors](https://ai-docs.amosdevelopment.com/03-amos-graphics-reference-guide-part-2.md#t_tochangeanobjectscolors)
[LabelAParameterColor]
###### Border color
*Help context ID: 3363*
Menu: **View****®****Object Properties****®****Colors****®****Border color**
Color of arrows and of the borders of rectangles and ellipses. Click on the color sample to choose another color.
See also:
[To change an object's colors](https://ai-docs.amosdevelopment.com/03-amos-graphics-reference-guide-part-2.md#t_tochangeanobjectscolors)
[LabelBorderColor]
###### Fill color
*Help context ID: 3364*
Menu: **View****®****Object Properties****®****Colors****®****Fill color**
Color of the interior of rectangles and ellipses. Click on the color sample to choose another color. If **Fill style** is **Transparent**, **Fill color** is ignored.
See also:
[To change an object's colors](https://ai-docs.amosdevelopment.com/03-amos-graphics-reference-guide-part-2.md#t_tochangeanobjectscolors)
[LabelFillColor]
###### Line width
*Help context ID: 3365*
Menu: **View****®****Object Properties****®****Colors****®****Line width**
Specifies the width (in units of 1/96 inch) of lines used to draw rectangles, ellipses and arrows. Leave the line width blank in the **Object Properties** dialog if you want to use the default line width specified on the **Pen Width** tab of the **Interface Properties** dialog. See [To specify the line width (pen width)](#t_tochoosethewidthoflinesandarrowheads1).
See also:
[To change the line width (pen width) for a single object](https://ai-docs.amosdevelopment.com/03-amos-graphics-reference-guide-part-2.md#t_tochangethewidthoflines1)
**Programming**
In Amos Graphics programs, you can select the first item in this ComboBox as follows (Visual Basic):
Dim aComboBox As Windows.Forms.ComboBox = Pd.GetComboBox("", "PenwidthCombo")
aComboBox.SelectedIndex = 0
###### Color Gradient Dialog
*Help context ID: 3440*
Menu: **View****®****Object Properties****®****Colors****®****Fill color**
The **Color Gradient** dialog allows you to choose the two colors that define a [color gradient](#t_8215).
[ColorSelector]
###### About color gradients
Menu: **View****®****Object Properties****®****Colors****®****Fill color**
You can apply *color gradients* to rectangles and ellipses in a path diagram. A color gradient consists of a gradual transition of one color to another color. The following figure shows a color gradient that changes from blue to green.

To specify a color gradient for a rectangle or ellipse, you must specify two colors. You can obtain a solid color by specifying both colors to be the same.
###### Color 1
Menu: **View****®****Object Properties****®****Colors****®****Fill color**
**Color 1** is the first of two colors that define a [color gradient](#t_8215). You can choose a named color from the dropdown list, or you can specify the red, green and blue components of **Color 1** by adjusting the red, green and blue scrollbars.
[ComboColorList]
###### Color 2
Menu: **View****®****Object Properties****®****Colors****®****Fill color**
**Color 2** is the second of two colors that define a [color gradient](#t_8215). You can choose a named color from the dropdown list, or you can specify the red, green and blue components of **Color 2** by adjusting the red, green and blue scrollbars.
[ComboColorList2]
###### Red Component of Color 1
Menu: **View****®****Object Properties****®****Colors****®****Fill color**
Use this scrollbar to adjust the red component of [Color 1](#t_ag-colorselector-labelcolor1) (one of the two colors that define a [color gradient](#t_8215)).
[ScrollRed]
###### Green Component of Color 1
Menu: **View****®****Object Properties****®****Colors****®****Fill color**
Use this scrollbar to adjust the green component of [Color 1](#t_ag-colorselector-labelcolor1) (one of the two colors that define a [color gradient](#t_8215)).
[ScrollGreen]
###### Blue Component of Color 1
Menu: **View****®****Object Properties****®****Colors****®****Fill color**
Use this scrollbar to adjust the blue component of [Color 1](#t_ag-colorselector-labelcolor1) (one of the two colors that define a [color gradient](#t_8215)).
[ScrollBlue]
###### Opacity of Color 1
Menu: **View****®****Object Properties****®****Colors****®****Fill color**
Use this scrollbar to adjust the opacity of [Color 1](#t_ag-colorselector-labelcolor1) (one of the two colors that define a [color gradient](#t_8215)). Move the scrollbar all the way to the left to make Color 1 completely transparent. Move it all the way to the right to make Color 1 completely opaque.
[ScrollOpacity]
###### Red Component of Color 2
Menu: **View****®****Object Properties****®****Colors****®****Fill color**
Use this scrollbar to adjust the red component of [Color 2](#t_ag-colorselector-labelcolor2) (one of the two colors that define a [color gradient](#t_8215)).
[ScrollRed2]
###### Green Component of Color 2
Menu: **View****®****Object Properties****®****Colors****®****Fill color**
Use this scrollbar to adjust the green component of [Color 2](#t_ag-colorselector-labelcolor2) (one of the two colors that define a [color gradient](#t_8215)).
[ScrollGreen2]
###### Blue Component of Color 2
Menu: **View****®****Object Properties****®****Colors****®****Fill color**
Use this scrollbar to adjust the blue component of [Color 2](#t_ag-colorselector-labelcolor2) (one of the two colors that define a [color gradient](#t_8215)).
[ScrollBlue2]
###### Opacity of Color 2
Menu: **View****®****Object Properties****®****Colors****®****Fill color**
Use this scrollbar to adjust the opacity of [Color 2](#t_ag-colorselector-labelcolor2) (one of the two colors that define a [color gradient](#t_8215)). Move the scrollbar all the way to the left to make Color 2 completely transparent. Move it all the way to the right to make Color 2 completely opaque.
[ScrollOpacity2]
###### Format tab
*Help context ID: 3357*
Menu: **View****®****Object Properties****®****Format**
Use the **Format** tab to specify how parameter values are displayed for a single object. For details, see:[ To change parameter formats for one object ](https://ai-docs.amosdevelopment.com/03-amos-graphics-reference-guide-part-2.md#t_tochangeparameterformatsforoneobject1)
To set the default parameter format for all objects, see: [Formats tab](#t_formatstab).
###### Parameter display format for a single object
*Help context ID: 3391*
Menu: **View****®****Object Properties****®****Format**
Enter a format for displaying parameter values associated with the currently selected object only. See [To change parameter formats for one object](https://ai-docs.amosdevelopment.com/03-amos-graphics-reference-guide-part-2.md#t_tochangeparameterformatsforoneobject1)
[F1Book1]
###### Visibility tab
*Help context ID: 3358*
Menu: **View****®****Object Properties****®****Visibility**
Use the **Visibility** tab to hide parts of the path diagram.
###### Use visibility settings
*Help context ID: 3379*
Menu: **View****®****Object Properties****®****Visibility****®****Use visibility settings**
Uncheck this box to display all parts of the path diagram. When the **Use visibility settings** box is unchecked, the states of the **Show picture, Show parameters** and **Show name** boxes are ignored -- no parts of the path diagram are hidden.
See also:
[Hiding objects, names and parameters](https://ai-docs.amosdevelopment.com/03-amos-graphics-reference-guide-part-2.md#t_hidingobjectsnamesandparameters)
**Programming**
In Amos Graphics programs, you can put a check mark in this check box by using the following statement (Visual Basic):
Pd.GetCheckBox("ObjectPropertiesForm", "checkUseVisibility").Checked = True
###### Show picture
*Help context ID: 3376*
Menu: **View****®****Object Properties****®****Visibility****®****Show picture**
Uncheck this box to hide a rectangle, ellipse or arrow. The state of this box has no effect on the display of parameters or variable names.
Note: When the **Use visibility settings** box is unchecked, the state of the **Show picture** box is ignored -- no parts of the path diagram are hidden.
See also:
[Hiding objects, names and parameters](https://ai-docs.amosdevelopment.com/03-amos-graphics-reference-guide-part-2.md#t_hidingobjectsnamesandparameters)
**Programming**
In Amos Graphics programs, you can put a check mark in this check box by using the following statement (Visual Basic):
Pd.GetCheckBox("ObjectPropertiesForm", "CheckVisible_Picture").Checked = True
###### Show parameters
*Help context ID: 3378*
Menu: **View****®****Object Properties****®****Visibility****®****Show parameters**
Uncheck this box to hide any parameters associated with a rectangle, ellipse or arrow. The state of this box has no effect on the display of variable names, rectangles, ellipses or arrows.
Note: When the **Use visibility settings** box is unchecked, the state of the **Show parameters** box is ignored -- no parts of the path diagram are hidden.
See also:
[Hiding objects, names and parameters](https://ai-docs.amosdevelopment.com/03-amos-graphics-reference-guide-part-2.md#t_hidingobjectsnamesandparameters)
**Programming**
In Amos Graphics programs, you can put a check mark in this check box by using the following statement (Visual Basic):
Pd.GetCheckBox("ObjectPropertiesForm", "CheckVisible_Parameters").Checked = True
###### Show name
*Help context ID: 3377*
Menu: **View****®****Object Properties****®****Visibility****®****Show name**
Uncheck this box to hide a variable's name. The state of this box has no effect on the display of parameters, or of rectangles, ellipses and arrows.
Note: When the **Use visibility settings** box is unchecked, the state of the **Show name** box is ignored -- no parts of the path diagram are hidden.
See also:
[Hiding objects, names and parameters](https://ai-docs.amosdevelopment.com/03-amos-graphics-reference-guide-part-2.md#t_hidingobjectsnamesandparameters)
**Programming**
In Amos Graphics programs, you can put a check mark in this check box by using the following statement (Visual Basic):
Pd.GetCheckBox("ObjectPropertiesForm", "CheckVisible_Name").Checked = True
###### Set Default button
*Help context ID: 3375*
Menu: **View****®****Object Properties**
Use the currently selected object as a pattern for new objects.
Programming
In Amos Graphics programs, you can click this button as follows (Visual Basic):
Dim aButton As Windows.Forms.Button = Pd.GetButton("", "cmdSetDefault") aButton.PerformClick
###### Undo button
*Help context ID: 3367*
Menu: **View****®****Object Properties**
Pressing this button undoes the changes made to the properties of the currently selected object.
Programming
In Amos Graphics programs, you can click this button as follows (Visual Basic):
Dim aButton As Windows.Forms.Button = Pd.GetButton("", "btnUndo") aButton.PerformClick
##### View variables in model
*Help context ID: 89*
Menu: **View****®****Variables in Model...**
Display a list of variables in the model. You can drag variable names from this list to the path diagram or to other places -- even to some other applications.
[ListModelVariablesForm]
See also:
[List of variables in the model](#t_listofvariablesinthemodel1)
###### List of variables in the model
Menu: **View****®****Variables in Model**
A list of variables in the model. You can drag variable names from this list to the path diagram or to other places -- even to some other applications.
[List1]
##### View variables in dataset
*Help context ID: 90*
Menu: **View****®****Variables in Dataset...**
Pressing this button displays a list of variables in the data file. The variables are displayed in a table with three columns that contain, respectively, (1) variable names, (2) variable labels, and (3) index numbers that show the ordinal position of each variable in the data file. Each variable name is preceded by an icon that indicates whether the variable is a numeric () or a string () variable.

Click the **Name** column heading to sort the variables by name. Click the **Label** column heading to sort by variable label (if variable labels are present). If you have re-ordered the variables by name or label, you can restore the original order by clicking the **#** column heading.
You can drag variable names from this list to the path diagram. If you drag a name to an existing rectangle, that variable name will be assigned to the rectangle. If you drag a name to an unoccupied region of the path diagram, a rectangle will be created to contain the name.
[ListDataVariablesForm]
###### List of variables in the data set
*Help context ID: 3261, 3271*
Menu: **View****®****Variables in Dataset**
A list of variables in the data file. You can drag variable names from this list to other places (for example, to the path diagram.)
[List1]
##### View parameters
*Help context ID: 91, 3281*
Menu: **View****®****Parameters...**
Pressing this button displays a list of names and constants assigned to model parameters. Names and constants can be dragged to objects in the path diagram.
[ListParametersForm]
###### Parameter names and values
Menu: **View****®****Parameters**
A list of parameter names and values used in the model. You can drag names and values from this list to other places (even to other applications).
[Tree1]
##### Switch to Other View
*Help context ID: 92*
Menu: **View****®****Switch to Other View**
Toggles between the Path diagram view and the Tables view.
##### View text output
*Help context ID: 42*
Menu: **View****®****Text Output**
This button displays the text output from an analysis. Every time you do an Amos analysis (by clicking **Analyze****®****Calculate Estimates**) the Amos text output is placed in a file with the extension **.AmosOutput**. Clicking  displays the text output from the analysis of the current path diagram. If  is disabled, you may need to click **Analyze****®****Calculate Estimates** to bring the text output file up to date.
###### Output Viewer
*Help context ID: 11200*
Menu: **View****®****Text Output**
**Keyboard navigation**: Use TAB to cycle through the elements of this window. Use CTRL-1, CTRL-2,...,CTRL-6 to move the keyboard focus to a specific element.
This window displays the text output from an analysis.
###### Navigation tree
*Help context ID: 11201*
**Keyboard navigation:** Use CTRL-1 to move the keyboard focus to the navigation tree.
Click on the branches of this tree to view selected portions of the text output.
In the following figure, the output viewer displays a portion of the output from an analysis with two groups and two models. In this example, the navigation panel on the left has been used to select bootstrap standard errors associated with variance estimates for 'Group number 1' and 'Model A'.
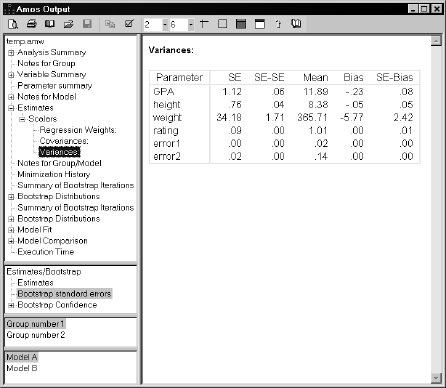
###### Estimates or bootstrap results
*Help context ID: 11202*
**Keyboard navigation:** Use CTRL-2 to move the keyboard focus to this list.
In an analysis where bootstrap standard errors or bootstrap confidence intervals were requested, click here to choose among
- estimates
- bootstrap standard errors
- bootstrap confidence intervals and significance values
###### Groups
*Help context ID: 11203*
**Keyboard navigation:** Use CTRL-3 to move the keyboard focus to this list.
In viewing the results of a multiple-group analysis, click here to view results that pertain to a particular group.
###### Models
*Help context ID: 11204*
**Keyboard navigation:** Use CTRL-4 to move the keyboard focus to this list.
In viewing the results of a multiple-model analysis, click here to view results that pertain to a particular model.
###### Toolbar
**Keyboard navigation:** Use CTRL-6 to move the keyboard focus to the toolbar.
The toolbar in the output viewer includes tools you can use to
- display a print preview of the output file
- print the output file
- change the page format for printing (paper size, margins, and so on)
- open a different output file
- copy the current selection to the Clipboard
- choose whether to view the entire output file, or just the portion that is selected in the navigation panel
- choose whether to show variable names or labels (when available), and choose formatting options for names and labels
- specify the number of decimal places used for displaying numerical results
- specify the spacing between table columns
- specify table formatting
You can access online help for an individual toolbar button by holding the mouse pointer over the button and pressing F1.
###### Print Preview
View the portion of the output file that is displayed in the **Amos Output** window, formatted for printing.
To view the entire output file, click . Then in the **Options** window, click the **View** tab and select **View entire output file**.
To view the portion of the output file that is selected in the tree at the left side of the Amos Output window, click . Then in the **Options** window, click the **View** tab and select **View selected output only**.
###### Print
Print the portion of the output file that is displayed in the **Amos Output** window.
To view the entire output file, click . Then in the **Options** window, click the **View** tab and select **View entire output file**.
To view the portion of the output file that is selected in the tree at the left side of the **Amos Output** window, click . Then in the **Options** window, click the **View** tab and select **View selected output only**.
###### Page Setup
Select page size, page margins, page header and footer.
- Select a printer and printer options.
###### Open
Browse for and open an Amos output (\*.AmosOutput) file.
###### Save
*Help context ID: 11216*
Save the contents of the **Amos Output** viewer as a file. In normal use, the **Amos Output** viewer is used to view existing files, and the  button is disabled.
###### Copy to Clipboard
Copies selected text from the **Amos Output** viewer to the clipboard.
To copy an entire table, left-click any portion of the table, then right-click, then choose **Copy** from the menu that pops up.
###### Options
Selects **Amos Output** viewer options, such as
- whether to view the entire output file, or only the part that is selected in the navigation tree.
- whether to display variable names or variable labels
- whether to display variable names (or variable labels) in upper, lower or mixed case
###### Options Window (Amos Output)
*Help context ID: 11260*
The **Options** window allows selecting among **Amos Output** viewer options, such as
- whether to view the entire output file, or only the part that is selected in the navigation tree.
- whether to display variable names or variable labels
- whether to display variable names (or variable labels) in upper, lower or mixed case
###### View entire output file
*Help context ID: 11271*
Displays the entire output file in the right-hand pane of the **Amos Output** viewer.
###### View selected output
*Help context ID: 11272*
Displays only that portion of the output file that is selected in the navigation tree.
###### Internet Options
*Help context ID: 11273*
Clicking this button displays the **Internet Properties** dialog, just as if you had selected **Tools **®** Internet Options** in Internet Explorer. You can use the **Internet Properties** dialog to specify display characteristics such as colors and fonts, just as in Internet Explorer.
###### Name or Label
*Help context ID: 11266*
Allows you to specify whether variables are identified by
- variable name
- variable label
- variable name, followed by variable label in parentheses
- variable label, followed by variable name in parentheses
Variable labels can be obtained from SPSS Statistics data files. You can also enter variable labels manually. (See [To label a variable with a string other than its name](https://ai-docs.amosdevelopment.com/03-amos-graphics-reference-guide-part-2.md#t_tolabelavariablewithastringotherthanitsname1).)
###### Name
*Help context ID: 11267*
Display variable names.
###### Label
*Help context ID: 11268*
Display variable labels where available. If a variable has no label, display its name.
Variable labels can be obtained from SPSS Statistics data files. You can also enter variable labels manually. (See [To label a variable with a string other than its name](https://ai-docs.amosdevelopment.com/03-amos-graphics-reference-guide-part-2.md#t_tolabelavariablewithastringotherthanitsname1).)
###### Name (Label)
*Help context ID: 11269*
Identify a variable by its name, followed by its label in parentheses.
###### Label (Name)
*Help context ID: 11270*
Identify a variable by its label, followed by its name in parentheses.
###### Case
*Help context ID: 11261*
Specify the use of upper or lower case in displaying variable names and variable labels.
###### As is
*Help context ID: 11262*
Display variable names and labels exactly as found in the data file, or on the path diagram. Do not change any characters from lower case to upper case, or from upper case to lower case.
###### Upper
*Help context ID: 11263*
Display variable names and labels in upper case.
###### Lower
*Help context ID: 11264*
Display variable names and labels in lower case.
###### Title
*Help context ID: 11265*
Capitalize only the first character of each word in variable names and labels.
###### Decimals
Specifies the number of decimal places used for displaying numerical values.
Each text output (\*.AmosOutput) file has a default number of decimal places that is established at the time the file is created. If, for example, a text output file is created with a default of three decimal places for numerical values, the file will initially appear in the output viewer with numeric values displayed with three decimal places.
When you change the number of decimal places, the new setting becomes the default for text output files created in the future but does not affect text output files created in the past. For example, suppose you change the number of decimal places from three to four. This will change the numbers currently being displayed so that they are displayed with four decimal places. In addition, output files created in the future will have numbers that are displayed initially with four decimal places.
Note
This somewhat unintuitive approach to establishing a default number of decimal places for numerical values was adopted for performance reasons. Modifying the number of displayed decimal places can be a time-consuming operation for large files.
###### Column Spacing
Specifies the spacing (in points) between table columns. There are 72 points in an inch.
###### Maximum number of table columns
Specifies the maximum number of columns used for displaying tables. If a table has more columns than the value specified here, the table is split into multiple tables.
If you specify a value of zero, tables will not be split.
The **Amos Output** viewer does not "remember" the value you specify for the maximum number of columns. Each time you view an output file, you must specify the maximum number of columns in order to split the tables.
Splitting tables affects only the way a text output (\*.AmosOutput) file is displayed in the output viewer. It does not modify the file itself. For this reason, make sure that tables are unsplit before displaying an XPath expression for a table or table element, in order to be sure that the table structure that is displayed is the same as the table structure in the underlying (\*.AmosOutput) file.
###### Table Rules
When this button is in the pressed position, column labels in tables are separated from the table body by a horizontal rule. Row labels are separated from the table body by a vertical rule.
###### Table Border
When this button is in the pressed position, tables are surrounded by a solid border.
###### Table Color
Selects a background color for tables.
###### Table Heading Color
Selects a background color for table headings.
###### Microsoft Word
Menu: **View****®****Text Output****®****Microsoft Word**
This button is displayed only if Microsoft Word is installed on your computer.
Click this button to display Amos's text output in Microsoft Word. If you use Word to edit the text output be sure to save the edited document as a new file (under a new name). This is because Microsoft Word opens displaying the contents of a temporary file that will be deleted after Word closes (although not necessarily immediately after).
###### Microsoft Excel
Menu: **View****®****Text Output****®****Microsoft Excel**
This button is displayed only ff Microsoft Excel is installed on your computer.
Click this button to display Amos's text output in Microsoft Excel. If you use Excel to edit the text output be sure to save the edited document as a new file (under a new name). This is because Microsoft Excel opens displaying the contents of a temporary file that will be deleted after Excel closes (although not necessarily immediately after).
###### Web Browser
Menu: **View****®****Text Output****®****Web Browser**
This button is displayed only if your computer has a web browser.
Click this button to display Amos's text output in the default web browser. The button's icon depends on which web browser is the default. If, for example, Firefox is the default web browser, then the "Web Browser" button will display a Firefox icon.
###### About this Application
Displays the version number and license information for this program.
###### Help Contents
*Help context ID: 11226*
Opens a help window.
###### Popup menu
The output viewer includes a popup menu, which you can access by clicking anywhere in the output viewer and then right-clicking. The popup menu contains the following items:
- **Select**: Selects that portion of the output file. For example, clicking within a table selects the entire table. You can then copy the selection to the Clipboard, or drag it to another location.
- **Copy**: Copies the portion of the output file that you clicked to the Clipboard. For example, clicking within a table copies the entire table to the Clipboard.
- **Show Path**: Displays an XPATH expression for the portion of the output file you clicked. This is useful for users who write programs to extract information from Amos output files. (See For more information, see **XHTML format**, below. See also: [XPath Window](https://ai-docs.amosdevelopment.com/03-amos-graphics-reference-guide-part-2.md#t_xhtmlformat1) and [XHTML format](https://ai-docs.amosdevelopment.com/03-amos-graphics-reference-guide-part-2.md#t_xhtmlformat1).
###### Select
*Help context ID: 11227*
Select a portion of the displayed output.
###### Copy
*Help context ID: 11228*
Copy a portion of the displayed output to the clipboard.
###### Show XPath
*Help context ID: 11229*
Display an XPath expression for a portion of the displayed output.
###### XPath Window
*Help context ID: 11290*
An Amos text output file, with the file name extension AmosOutput, is an XHTML document. One advantage of the XHTML format is that, besides being suitable for presentation, it also designed for processing by other programs.
A key step in writing a program to access an Amos text output file is determining an XPath expression for the portion of the file that you want the program to read. For example, if you want your program to perform calculations using the factor score weights computed by Amos, you need to construct an XPath expression that tells where to find the factor score weights in the text output file. The **Amos Output** viewer can assist in this task.
While viewing an Amos text output file in the output viewer, you can right-click any portion of the displayed text output and select XPath from the menu that pops up. The **XPath** window then displays an XPath expression that points to the right-clicked portion of the text output file. The XPath window's **Copy** button can be used to place the XPath expression on the Windows clipboard for pasting into your program.
When viewing an XPath expression for a table or part of a table, note that splitting tables affects only the way a text output (\*.AmosOutput) file is displayed in the output viewer. It does not modify the file itself. For this reason, make sure that tables are unsplit before displaying an XPath expression for a table or table element, in order to be sure that the table structure that is displayed is the same as the table structure in the underlying (\*.AmosOutput) file.
###### Copy to Clipboard (XPath Window)
*Help context ID: 11291*
Click the **Copy** button to copy the XPath expression in the **XPath** window to the clipboard. If a portion of the expression is selected, only the selected portion is copied to the clipboard. If no part of the expression is selected, the entire expression is copied to the clipboard.
###### Example programs for processing text output
The two programs presented in this example perform calculations with the implied covariances in Example 2. The example assumes that you are familiar with XML programming and have the Microsoft XML parser installed.
A program for processing the implied covariances must first find the implied covariances within the text output file. The **Amos Output** viewer can provide assistance for writing the code for this task by displaying an XPath expression for any visible object in the viewer. The implied covariance matrix in Example 2 looks like this when displayed in the **Amos Output** viewer:
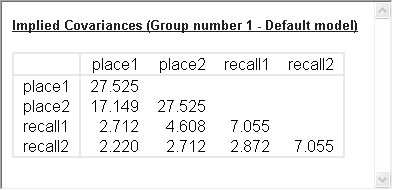
Suppose you want an XPath expression for selecting 2.220, the implied covariance between **recall2** and **place2**. Click anywhere in the **Implied Covariances** table, and then right-click the value 2.220 to display a popup menu.
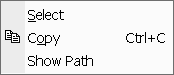
Click **Show Path** to display the **XPath** window.
The **XPath** window displays an XPath expression for selecting the value 2.220 in the implied covariance matrix. This expression can be copied and pasted into programs that you write.
To begin writing a Visual Basic 6 program to process Amos text output, click **Project**, then **References** on the VB6 menu. In the **References** window, put a check mark next to **Microsoft XML, V4.0**.
Enter the following program.
Option Explicit
Sub main()
Const FileName = "C:\Program Files\IBM\SPSS\Amos\\Examples\English\ex02.amosoutput"
Dim objDOM As MSXML2.DOMDocument40
Set objDOM = New MSXML2.DOMDocument40
Dim eRoot As IXMLDOMElement
Dim e As IXMLDOMElement
objDOM.async = False
If Not objDOM.Load(FileName) Then
Debug.Print "Error reading Amos text output file"
End If
Set eRoot = objDOM.documentElement
Set e = eRoot.selectSingleNode("xpath expression goes here")
Debug.Print e.Text
Debug.Print e.getAttribute("x")
End Sub
In the Amos Output viewer's XPath window, click **Copy** to copy the XPath expression to the clipboard. Then paste the expression into the Basic program, replacing the string **xpath expression goes here**.
Running the program displays two numbers. The program statement
Debug.Print e.Text
displays 2.220, the implied covariance between **recall2** and **place1** as currently displayed by the output viewer. The program statement
Debug.Print e.getAttribute("x")
displays 2.22048708774092, the same implied covariance with extended precision.
**Efficient processing of tables**
In order to perform efficient processing of an entire table, the XPath expression for selecting a value in a table can be split into two expressions: an expression that selects the body of the table (excluding the column labels) and a second expression that selects an individual value within the table body. The following Visual Basic 6 program illustrates this technique by modifying the XPath expression used in the first program of this example. The following program displays the number of rows in the table of implied covariances. Then it displays the sum of the implied variances.
Option Explicit
Sub main()
Const FileName = "C:\Program Files\IBM\SPSS\Amos\\Examples\English\ex02.amosoutput"
Dim objDOM As MSXML2.DOMDocument40
Set objDOM = New MSXML2.DOMDocument40
Dim eRoot As IXMLDOMElement
objDOM.async = False
If Not objDOM.Load(FileName) Then
Debug.Print "Error reading Amos text output file"
End If
Set eRoot = objDOM.documentElement
Dim eTableBody As IXMLDOMElement
Set eTableBody = eRoot.selectSingleNode("body/div/div[@ntype='models']/div[@ntype='model'][position() = 1]/div[@ntype='group'][position() = 1]/div[@ntype='estimates']/div[@ntype='matrices']/div[@ntype='covariances']/table/tbody")
Dim NumberOfRows As Long
NumberOfRows = eTableBody.childNodes.length
Debug.Print "Number of rows = "; NumberOfRows
Dim i As Long
Dim dSum As Double
dSum = 0
For i = 1 To NumberOfRows
dSum = dSum + MatrixElement(eTableBody, i, i)
Next
Debug.Print "Sum of variances = "; dSum
End Sub
'Return a single element of a numeric matrix
Function MatrixElement(eTableBody As IXMLDOMElement, row As Long, column As Long) As Double
Dim e As IXMLDOMElement
Set e = eTableBody.childNodes(row - 1).childNodes(column)
MatrixElement = CDbl(e.getAttribute("x"))
End Function
###### Use-it-in-a-sentence help
Some numbers in Amos's output have English-language usage examples associated with them. When you pass the mouse over a number that has a usage example, the number displays as a link and the pointer changes to a hand. Click the link to view the usage example.
###### Context-sensitive help
Many section and table headings have help topics associated with them. When you pass the mouse over an item that has a help topic associated with it, the text displays as a link and the pointer changes to a hand. Click the link to view the help topic.
##### Full screen
*Help context ID: 60*
Menu: **View****®****Full Screen**
When [](#t_fullscreen1) is in the unpressed position, the menu is visible and you can adjust the size of the path diagram window. When [](#t_fullscreen1) is in the pressed position, the menu is invisible and the path diagram fills the screen.
###### Full screen
*Help context ID: 3450*
This window appears on top of the path diagram after you use [View→Full Screen](#t_fullscreen1). Press **Close Full Screen** to make the path diagram sizable and to show the Amos Graphics menu.
###### Close Full Screen
*Help context ID: 3451*
Menu: **View****®****Full Screen**
Pressing this button makes the menu visible and allows you to adjust the size of the path diagram window.
##### Version history
*Help context ID: 124*
Menu: **View****®****Version history**
View a list of previous versions of the current model. You can revert to any previous version in the version history.
The current version of the model is added to the version history every time you save it, provided that you have requested this option on the [View→Interface properties→Versions](#t_versions-tab) tab.
###### Family tree
*Help context ID: 3277*
Menu: **View****®****Version history**
Display a tree structure where each node in the tree represents a historical version of the model.
###### Time line
*Help context ID: 3278*
Menu: **View****®****Version history**
Display a list of historical versions of the model in order of creation.
###### Tree view of version history
Menu: **View****®****Version history**
The *Family tree* displays each historical version of the model in a tree structure where each version of the model (except for the first version that was added to the tree) is a child with one parent. Each child was created by modifying its parent.
Click a version in the tree to view any notes that you made to describe that version.
Double-click a version in the tree to open that version in Amos.
You can also navigate the tree by using the arrow keys and the Enter key on the keyboard.
###### Time line view of version history
Menu: **View****®****Version history**
The *Time line* displays a list of historical versions of the model in order of creation.
Click a version in the list to view any notes that you made to describe that version.
Double-click a version in the list to open that version in Amos.
You can also navigate the list by using the up and down arrow keys and the Enter key on the keyboard.
###### Notes on the selected version
Menu: **View****®****Version history**
Notes that describe the model that is selected in the list or the tree structure that is on the left side of this dialog. You can edit these notes.
#### Diagram menu
*Help context ID: 3920*
Menu: **Diagram**
- [Diagram→Draw Observed](#t_drawobservedvariables) (Draw observed variables)
- [Diagram→Draw Unobserved](#t_drawunobservedvariables) (Draw unobserved variables)
- [Diagram→Draw Path](#t_drawpaths)
- [Diagram→Draw Covariance](#t_drawcovariances)
- [Diagram→Figure Caption](#t_addfigurecaptions) (Add figure captions)
- [Diagram→Draw Indicator Variable](#t_drawlatentvariablesandindicators) (Draw latent variables and indicators)
- [Diagram→Draw Unique Variable](#t_drawuniquevariables)
- [Diagram→Zoom](#t_zoominonaselectedarea) (Zoom in on a selected area)
- [Diagram→Zoom In](#t_zoomin)
- [Diagram→Zoom Out](#t_zoomout)
- [Diagram→Zoom Page](#t_zoomtoviewafullpage) (Zoom to view a full page)
- [Diagram→Scroll](#t_scroll)
- [Diagram→Loupe](#t_inspectthepathdiagramundermagnification) (Inspect the path diagram under magnification)
- [Diagram→Redraw Diagram](#t_redrawthepathdiagram) (Redraw the path diagram)
##### Draw observed variables
*Help context ID: 101*
Menu: **Diagram****®****Draw Observed**
Shortcut: **F3**
This button allows you to draw rectangles to represent observed variables. Place the mouse pointer at the center of the desired rectangle. Press the left mouse button and hold it down while moving the mouse pointer to adjust the size of the new rectangle. Release the button when you are satisfied with the appearance of the rectangle.
You can move a rectangle with [](#t_moveobjects) or change its size and shape with [](#t_changetheshapeofobjects).
After you have drawn one rectangle, you can draw another one just like it by clicking on the path diagram.
See also:
[](#t_changetheshapeofobjects) [Change the shape of objects](#t_changetheshapeofobjects)
[](https://ai-docs.amosdevelopment.com/03-amos-graphics-reference-guide-part-2.md#t_drawcirclesandsquares) [Draw circles and squares](https://ai-docs.amosdevelopment.com/03-amos-graphics-reference-guide-part-2.md#t_drawcirclesandsquares)
[](https://ai-docs.amosdevelopment.com/03-amos-graphics-reference-guide-part-2.md#t_drawgoldensections) [Draw golden sections](https://ai-docs.amosdevelopment.com/03-amos-graphics-reference-guide-part-2.md#t_drawgoldensections)
[](#t_drawunobservedvariables) [Draw unobserved variables](#t_drawunobservedvariables)
[](#t_moveobjects) [Move objects](#t_moveobjects)
[](#t_toggleobservedunobserved) [Toggle observed/unobserved](#t_toggleobservedunobserved)
##### Draw unobserved variables
*Help context ID: 2*
Menu: **Diagram****®****Draw Unobserved**
Shortcut: **F4**
This choice allows you to draw ellipses to represent unobserved variables. To draw an ellipse, press the left mouse button and hold it down while moving the mouse pointer to adjust the size of the ellipse. Release the button when you are satisfied with the appearance of the ellipse.
You can move an ellipse with [](#t_moveobjects) or change its size and shape with [](#t_changetheshapeofobjects).
After you have drawn one ellipse, you can draw another one just like it by clicking on the path diagram.
See also:
[](#t_changetheshapeofobjects) [Change the shape of objects](#t_changetheshapeofobjects)
[](https://ai-docs.amosdevelopment.com/03-amos-graphics-reference-guide-part-2.md#t_drawcirclesandsquares) [Draw circles and squares](https://ai-docs.amosdevelopment.com/03-amos-graphics-reference-guide-part-2.md#t_drawcirclesandsquares)
[](https://ai-docs.amosdevelopment.com/03-amos-graphics-reference-guide-part-2.md#t_drawgoldensections) [Draw golden sections](https://ai-docs.amosdevelopment.com/03-amos-graphics-reference-guide-part-2.md#t_drawgoldensections)
[](#t_drawlatentvariablesandindicators) [Draw latent variables and indicators](#t_drawlatentvariablesandindicators)
[](#t_drawobservedvariables) [Draw observed variables](#t_drawobservedvariables)
[](#t_drawuniquevariables) [Draw unique variables](#t_drawuniquevariables)
[](#t_moveobjects) [Move objects](#t_moveobjects)
[](#t_toggleobservedunobserved) [Toggle observed/unobserved](#t_toggleobservedunobserved)
##### Draw paths
*Help context ID: 3*
Menu: **Diagram****®****Draw Path**
Shortcut: **F5**
Press this button to draw single-headed arrows from one variable to another. Point to one variable and press the left mouse button. While continuing to hold the mouse button down, point to a second variable. Then release the button. This will cause an arrow to be drawn from the first variable to the second.
After you have drawn a single-headed arrow, you can move one end at a time with [](#t_moveobjects).
See also:
[](#t_drawcovariances) [Draw covariances](#t_drawcovariances)
[](#t_moveobjects) [Move objects](#t_moveobjects)
###### Resolve Conflict dialog
*Help context ID: 3750*
This dialog appears when you use [Diagram→Draw Path](#t_drawpaths) to try to make a single-headed arrow point to an exogenous variable whose variance is constrained.
###### Do not draw/move the arrow
*Help context ID: 3751*
Do not draw/move the arrow. Leave the constraint on the variance alone. The variable remains exogenous.
###### Remove the constraint on the variance, and draw/move the arrow
*Help context ID: 3752*
Remove the constraint on the variance, and draw/move the arrow. The variable that the arrow points to becomes endogenous so that its variance is no longer a model parameter.
##### Draw covariances
*Help context ID: 4*
Menu: **Diagram****®****Draw Covariance**
Shortcut: **F6**
This button draws double-headed arrows. Point to one variable and press the left mouse button. While continuing to hold the mouse button down, point to a second variable. Then release the button. This will cause the two variables to be connected by a double- headed arrow. The arrow will be curved, in clockwise direction, depending on which variable was pointed to first.
After you have drawn a double-headed arrow, you can change its shape with [](#t_changetheshapeofobjects). You can move either end of the arrow with [](#t_moveobjects).
See also:
[](#t_changetheshapeofobjects) [Change the shape of objects](#t_changetheshapeofobjects)
[](#t_drawpaths) [Draw paths](#t_drawpaths)
[](#t_moveobjects) [Move objects](#t_moveobjects)
##### Add figure captions
*Help context ID: 6*
Menu: **Diagram****®****Figure Caption**
This button lets you create a figure caption or edit an existing caption. You can use [text macros](#t_textmacros1) within a caption to display fit measures and other information such as the current date and time.
To create a caption, click on the spot where you want the caption to appear. The following dialog box appears.
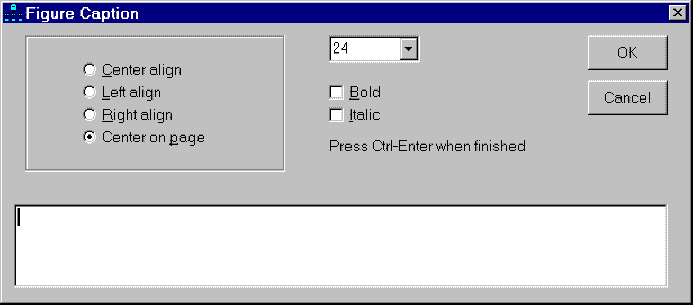
To edit an existing caption, press [](#t_addfigurecaptions) and click on the caption.
See also:
[To choose typefaces for path diagrams](https://ai-docs.amosdevelopment.com/03-amos-graphics-reference-guide-part-2.md#t_tochoosetypefacesforpathdiagrams1)
[titleform]
###### Elements of the Figure Caption dialog
Menu: **Diagram****®****Figure Caption**
###### Center align
*Help context ID: 3331*
Menu: **Diagram****®****Figure Caption****®****Center align**
In a multi-line figure caption, line up the centers of the lines.
Programming
To obtain a reference to this radio button in an Amos program, use the method [GetRadioButton](https://ai-docs.amosdevelopment.com/04-programming-with-amos-part-1.md#t_7787)("titleform", "OptionHPosition_Center").
###### Left align
*Help context ID: 3332*
Menu: **Diagram****®****Figure Caption****®****Left align**
In a multi-line figure caption, left-justify the lines.
Programming
To obtain a reference to this radio button in an Amos program, use the method [GetRadioButton](https://ai-docs.amosdevelopment.com/04-programming-with-amos-part-1.md#t_7787)("titleform", "OptionHPosition_Left").
###### Right align
*Help context ID: 3333*
Menu: **Diagram****®****Figure Caption****®****Right align**
In a multi-line figure caption, right-justify the lines.
Programming
To obtain a reference to this radio button in an Amos program, use the method [GetRadioButton](https://ai-docs.amosdevelopment.com/04-programming-with-amos-part-1.md#t_7787)("titleform", "OptionHPosition_Right").
###### Center on page
*Help context ID: 3334*
Menu: **Diagram****®****Figure Caption****®****Center on page**
Center the figure caption horizontally on the page.
Programming
To obtain a reference to this radio button in an Amos program, use the method [GetRadioButton](https://ai-docs.amosdevelopment.com/04-programming-with-amos-part-1.md#t_7787)("titleform", "OptionHPosition_CenterOnPage").
###### Font size (figure caption)
*Help context ID: 3335*
Menu: **Diagram****®****Figure Caption****®****Font size**
Allows you to choose the font size for an the currently selected figure caption. To choose a typeface for all figure captions, see [To choose typefaces for path diagrams](https://ai-docs.amosdevelopment.com/03-amos-graphics-reference-guide-part-2.md#t_tochoosetypefacesforpathdiagrams1).
See [To change the font for a figure caption](https://ai-docs.amosdevelopment.com/03-amos-graphics-reference-guide-part-2.md#t_tochangethefontforafigurecaption1)
Programming
To obtain a reference to this combo box in an Amos program, use the method [GetComboBox](https://ai-docs.amosdevelopment.com/04-programming-with-amos-part-1.md#t_8362)("titleform", "CaptionCombo").
###### Bold
*Help context ID: 3336*
Menu: **Diagram****®****Figure Caption****®****Bold**
Checking this box displays the currently selected figure caption in a bold font.
See [To change the font for a figure caption](https://ai-docs.amosdevelopment.com/03-amos-graphics-reference-guide-part-2.md#t_tochangethefontforafigurecaption1)
Programming
To obtain a reference to this check box in an Amos program, use the method [GetCheckBox](https://ai-docs.amosdevelopment.com/04-programming-with-amos-part-1.md#t_7786)("titleform", "check_bold").
###### Italic
*Help context ID: 3337*
Menu: **Diagram****®****Figure Caption****®****Italic**
Checking this box displays the currently selected figure caption in an italic font.
See [To change the font for a figure caption](https://ai-docs.amosdevelopment.com/03-amos-graphics-reference-guide-part-2.md#t_tochangethefontforafigurecaption1)
Programming
To obtain a reference to this check box in an Amos program, use the method [GetCheckBox](https://ai-docs.amosdevelopment.com/04-programming-with-amos-part-1.md#t_7786)("titleform", "check_italic").
###### Caption
*Help context ID: 3338*
Menu: **Diagram****®****Figure Caption****®****Caption**
Enter or edit the figure caption here. Changes to the text in this box are reflected immediately on the path diagram. You can use [text macros](#t_textmacros1) in figure captions.
Programming
To obtain a reference to this text box in an Amos program, use the method [GetTextBox](https://ai-docs.amosdevelopment.com/04-programming-with-amos-part-1.md#t_7788)("titleform", "ftitle").
###### Text macros
Menu: **Diagram****®****Figure Caption****®****Caption**
Suppose you type in a figure caption as follows.

When you view the input path diagram, the caption looks like this:
 .
However, once you have fitted your model (using [](#t_calculateestimates)), the path diagram that contains the results of the analysis will have a caption that looks something like this
 .
**\cmin** is a "text macro", a code that Amos fills in with the minimum value of the discrepancy function, C (see [Appendix B](https://ai-docs.amosdevelopment.com/07-appendices.md#t_appendixbdiscrepancyfunctions1)), once the minimum value is known. Similarly, **\df** is a text macro that Amos fills in with the number of degrees of freedom for testing the model and **\p** is a text macro that Amos fills in with the "p value" for testing the null hypothesis that the model is correct. Here is a list of text macros.
**\agfi** Adjusted goodness of fit index (AGFI)
**\aic** Akaike information criterion (AIC)
**\bcc** Browne-Cudeck criterion (BCC)
**\bic** Bayes information criterion (BIC)
**\caic** Consistent AIC (CAIC)
**\cfi** Comparative fit index (CFI)
**\cmin** Minimum value of the discrepancy function C in [Appendix B](https://ai-docs.amosdevelopment.com/07-appendices.md#t_appendixbdiscrepancyfunctions1)
**\cmindf** Minimum value of the discrepancy function divided by degrees of freedom
**\datafilename** The name of the data file. (**\longdatafilename** displays the fully qualified path name of the data file.)
**\datatablename** The name of the data table (for those file formats that allow a single file to contain multiple data tables, such as Excel workbooks.)
**\date** Today's date in short format. (**\longdate** displays today's date in long format.) The displayed date is made current whenever the path diagram is read from a file, saved or printed.
**\df** Degrees of freedom
**\ecvi** Expected cross-validation index (ECVI)
**\ecvihi** Upper bound of 90% confidence interval on ECVI
**\ecvilo** Lower bound of 90% confidence interval on ECVI
**\f0** Estimated population discrepancy (F0)
**\f0hi** Upper bound of 90% confidence interval on F0
**\f0lo** Lower bound of 90% confidence interval on F0
**\filename** Name of the current AMW file. (Use **\longfilename** to display the complete path to the current AMW file.)
**\fmin** Minimum value of discrepancy function F in [Appendix B](https://ai-docs.amosdevelopment.com/07-appendices.md#t_appendixbdiscrepancyfunctions1)
**\format** Format name (See [Formats tab](#t_formatstab).)
**\gfi** Goodness of fit index (GFI)
**\group** Group name (See [Manage groups](#t_managegroups).)
**\hfive** Hoelter's critical N for =.05
**\hone** Hoelter's critical N for =.01
**\ifi** Incremental fit index (IFI)
**\longdatafilename** The fully qualified path name of the data file. (**\datafilename** displays the data file name without the path.)
**\longdate** Today's date in long format. (**\date** display's today's date in short format.) The displayed date is made current whenever the path diagram is read from a file, saved or printed.
**\longfilename** Fully qualified path name of the current AMW file. (Use **\filename** to display the file name without the path.)
**\longtime** The time in long format. (**\time** displays the time in short format.) The displayed time is made current whenever the path diagram is read from a file, saved or printed.
**\mecvi** Modified ECVI (MECVI)
**\model** Model name (See [Manage models](#t_managemodels).)
**\ncp** Estimate of non-centrality parameter (NCP)
**\ncphi** Upper bound of 90% confidence interval on NCP
**\ncplo** Lower bound of 90% confidence interval on NCP
**\nfi** Normed fit index (NFI)
**\npar** Number of distinct parameters
**\p** "p value" associated with discrepancy function (test of perfect fit)
**\pcfi** Parsimonious comparative fit index (PCFI)
**\pclose** "p value" for testing the null hypothesis of close fit (RMSEA < .05)
**\pgfi** Parsimonious goodness of fit index (PGFI)
**\pnfi** Parsimonious normed fit index (PNFI)
**\pratio** Parsimony ratio
**\rfi** Relative fit index
**\rmr** Root mean square residual
**\rmsea** Root mean square error of approximation (RMSEA)
**\rmseahi** Upper bound of 90% confidence interval on RMSEA
**\rmsealo** Lower bound of 90% confidence interval on RMSEA
**\time** The time in short format. (**\longtime** displays the time in long format.) The displayed time is made current whenever the path diagram is read from a file, saved or printed.
**\tli** Tucker-Lewis index (TLI)
See [To specify the number of decimal places for text macros](https://ai-docs.amosdevelopment.com/03-amos-graphics-reference-guide-part-2.md#t_tospecifythenumberofdecimalplacesfortextmacros1).
###### OK
Menu: **Diagram****®****Figure Caption****®****OK**
Closes the dialog box and saves any changes you have made.
Programming
To obtain a reference to this button in an Amos program, use the method [GetButton](https://ai-docs.amosdevelopment.com/04-programming-with-amos-part-1.md#t_7785)("titleform", "ok").
###### Cancel
Menu: **Diagram****®****Figure Caption****®****Cancel**
Closes the dialog box and discards any changes you have made.
Programming
To obtain a reference to this button in an Amos program, use the method [GetButton](https://ai-docs.amosdevelopment.com/04-programming-with-amos-part-1.md#t_7785)("titleform", "cancel").
##### Draw latent variables and indicators
*Help context ID: 77*
Menu: **Diagram****®****Draw Indicator Variable**
When this button is in the pressed position you can perform either of two operations.
1. You can draw ellipses in the same way that [](#t_drawunobservedvariables) allows you to draw ellipses.
2. By clicking on an already-existing ellipse, you can add an indicator together with a unique variable. Scale constraints, necessary for model identification, will be put in place automatically. For example, clicking on the variable G in the following path diagram.

yields

Two more clicks on G give

See also:
[](#t_drawpaths) [Draw paths](#t_drawpaths)
[](#t_drawuniquevariables) [Draw unique variables](#t_drawuniquevariables)
[](#t_drawunobservedvariables) [Draw unobserved variables](#t_drawunobservedvariables)
[](#t_reflecttheindicatorsofalatentvariable) [Reflect the indicators of a latent variable](#t_reflecttheindicatorsofalatentvariable)
[](#t_rotatetheindicatorsofalatentvariable) [Rotate the indicators of a latent variable](#t_rotatetheindicatorsofalatentvariable)
See also:
[To constrain parameters](https://ai-docs.amosdevelopment.com/03-amos-graphics-reference-guide-part-2.md#t_toconstrainparameters1)
##### Draw unique variables
*Help context ID: 78*
Menu: **Diagram****®****Draw Unique Variable**
Pressing this button will allow you to add a unique variable to an existing variable. For example, clicking on the variable, A, in the following path diagram

yields

Each additional click on A will rotate its unique variable in the clockwise direction. For example, one more click on A gives

And another click gives

See also:
[](#t_drawlatentvariablesandindicators) [Draw latent variables and indicators](#t_drawlatentvariablesandindicators)
[](#t_drawpaths) [Draw paths](#t_drawpaths)
[](#t_drawunobservedvariables) [Draw unobserved variables](#t_drawunobservedvariables)
##### Zoom in on a selected area
*Help context ID: 8*
Menu: **Diagram****®****Zoom**
Shortcut: **Ctrl-Z**
This choice allows you to fill the Amos window with a selected portion of a path diagram. Move the mouse pointer to the center of the area that you want to focus on. Then press the left mouse button. Move the mouse (while continuing to hold the left button down) to select a rectangular region of the path diagram. When you release the mouse button, the selected region will be enlarged to fill the window.
See also:
[](#t_scroll) [Scroll](#t_scroll)
[](#t_zoomin) [Zoom in](#t_zoomin)
[](#t_zoomout) [Zoom out](#t_zoomout)
[](#t_zoomtoviewafullpage) [Zoom to view a full page](#t_zoomtoviewafullpage)
##### Zoom in
*Help context ID: 31*
Menu: **Diagram****®****Zoom In**
Shortcut: **F7**
This button magnifies the screen image of the path diagram. It does not affect the printed size of the path diagram.
See also:
[](#t_scroll) [Scroll](#t_scroll)
[](#t_zoominonaselectedarea) [Zoom in on a selected area](#t_zoominonaselectedarea)
[](#t_zoomout) [Zoom out](#t_zoomout)
[](#t_zoomtoviewafullpage) [Zoom to view a full page](#t_zoomtoviewafullpage)
##### Zoom out
*Help context ID: 32*
Menu: **Diagram****®****Zoom Out**
Shortcut: **F8**
This button reduces the size of the screen image of the path diagram. It does not affect the printed size of the path diagram.
See also:
[](#t_scroll) [Scroll](#t_scroll)
[](#t_zoomin) [Zoom in](#t_zoomin)
[](#t_zoominonaselectedarea) [Zoom in on a selected area](#t_zoominonaselectedarea)
[](#t_zoomtoviewafullpage) [Zoom to view a full page](#t_zoomtoviewafullpage)
##### Zoom to view a full page
*Help context ID: 33*
Menu: **Diagram****®****Zoom Page**
Shortcut: **F9**
This button resizes the screen image of the path diagram so that one printed page just fits the Amos window.
See also:
[](#t_scroll) [Scroll](#t_scroll)
[](#t_zoomin) [Zoom in](#t_zoomin)
[](#t_zoominonaselectedarea) [Zoom in on a selected area](#t_zoominonaselectedarea)
[](#t_zoomout) [Zoom out](#t_zoomout)
##### Scroll
*Help context ID: 30*
Menu: **Diagram****®****Scroll**
If you have enlarged the path diagram by pressing [](#t_zoomin) or [](#t_zoominonaselectedarea) you may be unable to see the entire path diagram at once. To see a different portion of the path diagram, press [](#t_scroll). Then press the mouse button and move the mouse.
You can also shift the path diagram up, down, left and right by using the scrollbars that are visible whenever the path diagram extends beyond the Amos Graphics window.
See also:
[](#t_zoomin) [Zoom in](#t_zoomin)
[](#t_zoominonaselectedarea) [Zoom in on a selected area](#t_zoominonaselectedarea)
[](#t_zoomout) [Zoom out](#t_zoomout)
[](#t_zoomtoviewafullpage) [Zoom to view a full page](#t_zoomtoviewafullpage)
##### Inspect the path diagram under magnification
*Help context ID: 25*
Menu: **Diagram****®****Loupe**
Shortcut: **F12**
Press this button, to use the mouse pointer as a magnifying glass.
See [To change the loupe magnification](https://ai-docs.amosdevelopment.com/03-amos-graphics-reference-guide-part-2.md#t_tochangetheloupemagnification1).
##### Redraw the path diagram
*Help context ID: 83*
Menu: **Diagram****®****Redraw Diagram**
This button erases the path diagram and redraws it.
#### Analyze menu
*Help context ID: 3925*
Menu: **Analyze**
- [Analyze→Calculate Estimates](#t_calculateestimates)
- [Analyze→Stop Calculating Estimates](#t_stopcalculatingestimates)
- [Analyze→Manage Groups](#t_managegroups)
- [Analyze→Manage Models](#t_managemodels)
- [Analyze→Modeling Lab](#t_runtheamosmodelinglaboratory) (Run the Amos modeling laboratory)
- [Analyze→Toggle Observed/Unobserved](#t_toggleobservedunobserved)
- [Analyze→Degrees of Freedom](#t_displaydegreesoffreedom) (Display degrees of freedom)
- [Analyze→Specification Search](#t_specification-search)
- [Analyze→Multiple-Group Analysis](#t_multiple-group-analysis)
- [Analyze→Bayesian Estimation](#t_bayesian-estimation)
- [Analyze→Data Imputation](https://ai-docs.amosdevelopment.com/03-amos-graphics-reference-guide-part-2.md#t_data-imputation)
- [Analyze→D-Separation Preview](https://ai-docs.amosdevelopment.com/03-amos-graphics-reference-guide-part-2.md#t_d-separationpreview)
##### Calculate estimates
*Help context ID: 7*
Menu: **Analyze****®****Calculate Estimates**
Shortcut: **Ctrl-F9**
This button fits the model specified by your path diagram(s). While the model is being fitted, a progress report is displayed in the panel in the lower left corner of the main Amos window.
After a successful analysis, you can
1. view the graphics output by pressing  in the panel to the left of the path diagram.
2. print the graphics output by pressing [](#t_printapathdiagram).
See also:
[](#t_printapathdiagram) [Print a path diagram](#t_printapathdiagram)
[](#t_stopcalculatingestimates) [Stop calculating estimates](#t_stopcalculatingestimates)
###### Amos Warnings dialog
*Help context ID: 3340*
This window warns of potential problems with the model. You have the option of proceeding with the analysis or canceling it.
[Warnings]
###### Proceed with the analysis
*Help context ID: 3341*
Ignore the warnings and proceed to fit the model.
Programming
To obtain a reference to this button in an Amos program, use the method [GetButton](https://ai-docs.amosdevelopment.com/04-programming-with-amos-part-1.md#t_7785)("Warnings", "Command1").
###### Cancel the analysis
*Help context ID: 3342*
Cancel the analysis -- do not attempt to fit the model.
Programming
To obtain a reference to this button in an Amos program, use the method [GetButton](https://ai-docs.amosdevelopment.com/04-programming-with-amos-part-1.md#t_7785)("Warnings", "Command2").
###### Warnings text box
*Help context ID: 3343*
A description of potential problems with the model appears here.
Programming
To obtain a reference to this text box in an Amos program, use the method [GetTextBox](https://ai-docs.amosdevelopment.com/04-programming-with-amos-part-1.md#t_7788)("Warnings", "Text1").
##### Stop calculating estimates
*Help context ID: 98*
Menu: **Analyze****®****Stop Calculating Estimates**
Stop the analysis that is now in progress. When fitting multiple models,  interrupts the fitting of a single model. The analysis then proceeds to any remaining models for which model fitting has not been attempted.
See also:
[](#t_calculateestimates) [Calculate estimates](#t_calculateestimates)
##### Manage groups
*Help context ID: 94*
Menu: **Analyze****®****Manage Groups...**
The **Manage Groups** dialog allows you to add, delete and rename groups.
[ManageGroupsForm]
###### Group Name
*Help context ID: 3191*
The name of the currently selected group. You can change the name by editing this box.
Programming
To obtain a reference to this text box in an Amos program, use the method [GetTextBox](https://ai-docs.amosdevelopment.com/04-programming-with-amos-part-1.md#t_7788)("ManageGroupsForm", "Text1").
###### New (group)
*Help context ID: 3192*
Creates a new group.
Programming
To obtain a reference to this button in an Amos program, use the method [GetButton](https://ai-docs.amosdevelopment.com/04-programming-with-amos-part-1.md#t_7785)("ManageGroupsForm", "btnNew").
###### Delete (a group)
*Help context ID: 3193*
Deletes the current group. Once a group is deleted, you cannot bring it back.
Programming
To obtain a reference to this button in an Amos program, use the method [GetButton](https://ai-docs.amosdevelopment.com/04-programming-with-amos-part-1.md#t_7785)("ManageGroupsForm", "btnDelete").
###### Close (Manage Groups)
Closes the dialog.
Programming
To obtain a reference to this button in an Amos program, use the method [GetButton](https://ai-docs.amosdevelopment.com/04-programming-with-amos-part-1.md#t_7785)("ManageGroupsForm", "btnClose").
###### To add a group
1. Press [](#t_managegroups). (Menu: **Analyze****®****Manage Groups**).
2. Press **New**. (Amos assigns a name like "Group number 2" to the new group.)
3. If you wish, enter a new name in the **Group Name** box.
###### To delete a group
1. Select a group from the list in the Amos window.
2. Press [](#t_managegroups). (Menu: **Analyze****®****Manage Groups**).
3. Press **Delete**.
###### To rename a group
1. Select a group from the list in the Amos window.
2. Press [](#t_managegroups). (Menu: **Analyze****®****Manage Groups**).
3. Enter a new name in the **Group Name** box.
##### Manage models
*Help context ID: 93*
Menu: **Analyze****®****Manage Models...**
The **Manage Models** dialog allows you to create, modify and delete models.
[ManageModelsForm]
###### Manage Models dialog
The following illustration shows how the **Manage Models** dialog is used to specify Model B of Example 11. The list of parameters at the left of the dialog shows that some regression weights are named. The names are b1, b2, b3, b4, b5, b6, g1, g2, g3, g4, g5, g6. Also, at least one regression weight is fixed at the value, 1. No other parameters (covariances, variances, means or intercepts) are named or assigned values. The Parameter Constraints box shows that regression weights named g1 are required to be equal to regression weights named b1, regression weights named g2 are required to be equal to regression weights named b2, and so on.

Here are some more examples of equality constraints that you can enter in the **Parameter Constraints** box:
a = b = c = d a = 5 a = b = c = d = 5
###### List of parameters in the model
*Help context ID: 3291*
A list of parameter names and values used in the path diagram.
Double-click on a parameter name or parameter value to copy it to the **Parameter Constraints** box.
[Tree1]
###### Model Name
*Help context ID: 3292*
The name of the current model. You can rename the model by editing this box.
Programming
To obtain a reference to this text box in an Amos program, use the method [GetTextBox](https://ai-docs.amosdevelopment.com/04-programming-with-amos-part-1.md#t_7788)("ManageModelsForm", "Text2").
###### Parameter Constraints (Manage Models)
*Help context ID: 3293*
Enter parameter constraints for the current model in this box.
See [Manage Models dialog](#t_managemodelsdialog).
Programming
To obtain a reference to this text box in an Amos program, use the method [GetTextBox](https://ai-docs.amosdevelopment.com/04-programming-with-amos-part-1.md#t_7788)("ManageModelsForm", "Text1").
###### New (model)
*Help context ID: 3294*
Creates a new model. See [To create a new model](#t_tocreateanewmodel1).
Programming
To obtain a reference to this button in an Amos program, use the method [GetButton](https://ai-docs.amosdevelopment.com/04-programming-with-amos-part-1.md#t_7785)("ManageModelsForm", "btnNew").
###### Delete (a model)
*Help context ID: 3295*
Deletes the current model. See [To delete a model](#t_todeleteamodel1).
Programming
To obtain a reference to this button in an Amos program, use the method [GetButton](https://ai-docs.amosdevelopment.com/04-programming-with-amos-part-1.md#t_7785)("ManageModelsForm", "btnDelete").
###### Close (Manage Models)
Closes the dialog.
Programming
To obtain a reference to this button in an Amos program, use the method [GetButton](https://ai-docs.amosdevelopment.com/04-programming-with-amos-part-1.md#t_7785)("ManageModelsForm", "btnClose").
###### To create a new model
1. Select the menu item **Analyze****®****Manage Models**
2. Press **New**. (Amos assigns a name like "Model Number 2" to the new group. The new model has no parameter constraints.)
3. Edit the name in the **Model Name** box, if you wish.
4. Enter parameter constraints in the **Parameter Constraints** box.
See [Manage Models dialog](#t_managemodelsdialog) to learn how to enter parameter constraints.
###### To delete a model
1. Double-click on a model in the list in the Amos window. (The **Manage Models** dialog opens.)
2. Press **Delete**.
###### To change parameter constraints for a model
1. Double-click on a model in the list in the Amos window. (The **Manage Models** dialog opens.)
2. Edit the parameter constraints in the **Parameter Constraints** box.
###### To rename a model
1. Double-click on a model in the list in the Amos window. (The **Manage Models** dialog opens.)
2. Edit the name in the **Model Name** box.
##### Run the Amos modeling laboratory
*Help context ID: 71*
Menu: **Analyze****®****Modeling Lab...**
The modeling laboratory provides a way for you to enter parameter values and observe the effect on the implied moments and on the value of the discrepancy function. When you press , a window like this appears on top of the path diagram:

Click on any path diagram object that has parameters in order to change its parameter values. If you click, say, on an exogenous variable, a window like this appears:

If the window is in the way, you can drag it with the mouse. In this example, the variable's mean is 1.074, and its variance is .796. You can edit these values. Then press the Enter key to recalculate the implied moments and the discrepancy function.
[Tutor]
###### Format->List Font (Amos Graphics)
*Help context ID: 3707*
Specifies a font for the group list, the model list and the minimization history.
###### Format->Spreadsheet Font
*Help context ID: 3708*
Specifies the font for sample moments and implied moments.
###### Edit Parameter
*Help context ID: 3407*
A parameter value associated with the currently selected object in the path diagram. You can edit the value in this box. Then press the Enter key to recalculate the discrepancy function.
[Mean or intercept: texta]
[Variance, covariance or weight: textb]
###### Parameter editing window
*Help context ID: 3408*
When you click on a path diagram object that has parameters, the parameter values appear in this window. You can edit the parameter values here and see the changes immediately on the path diagram. Then press the Enter key to recalculate the discrepancy function.
If this window is in the way, you can drag it with the mouse.
[Mean or intercept: texta]
[Variance, covariance or weight: textb]
###### Increment/Decrement Parameter
*Help context ID: 3404*
Increment or decrement the parameter value in the box to the immediate left. Then recalculate the discrepancy function.
###### Amos Step
*Help context ID: 3701*
Performs one iteration of Amos's discrepancy function minimization algorithm. Press **Amos Step** repeatedly to minimize the discrepancy function.
###### Groups (Modeling Lab)
*Help context ID: 3702*
In a multiple-group analysis, select a group from this list.
[groupcombo]
###### Models (Modeling Lab)
*Help context ID: 3703*
When multiple models are defined, select a model from this list. Making a new selection from this list resets the parameter values.
[modelcombo]
###### History
*Help context ID: 3704*
A history of discrepancy function values. Each time the discrepancy function is recalculated, the new value is entered in the **History** box.
[History]
###### Sample moments (Modeling Lab)
*Help context ID: 3705*
The sample variances/covariances and (when means and intercepts are explicit model parameters) sample means.
###### Implied moments (Modeling Lab)
*Help context ID: 3706*
The implied variances/covariances and (when means and intercepts are explicit model parameters) implied means.
##### Toggle observed/unobserved
*Help context ID: 22*
Menu: **Analyze****®****Toggle Observed/Unobserved**
When this button is in the pressed position, clicking on a rectangle will turn it into an ellipse. Clicking on an ellipse will turn it into a rectangle.
##### Display degrees of freedom
*Help context ID: 79*
Menu: **Analyze****®****Degrees of Freedom...**
This button calculates degrees of freedom. In the following example, the 21 "parameters" include those parameters that are fixed equal to a constant as well as those parameters that are constrained to be equal to some other parameter. The 13 "free parameters" do not include parameters that are fixed equal to a constant. Furthermore, several parameters that are constrained to be equal to each other count as a single free parameter.

The figures displayed with  do not take into account any parameter constraints imposed with [Manage models](#t_managemodels).
[DfForm]
###### Symbol list
*Help context ID: 3141*
List of parameter names and values, and the frequency with which each occurs.
[DFListView1]
###### Close
*Help context ID: 3142*
Closes this dialog.
Programming
To obtain a reference to this button in an Amos program, use the method [GetButton](https://ai-docs.amosdevelopment.com/04-programming-with-amos-part-1.md#t_7785)("DfForm", "Command1").
##### Specification search
*Help context ID: 107*
Menu: **Analyze****®****Specification Search...**
This button opens the [Specification Search window](#t_specificationsearchwindow) to perform a [specification search](#t_1132).
###### Specification Search (Exploratory SEM)
Structural equation modeling (SEM) is an intrinsically confirmatory technique, but in practice it is often used in an exploratory way. Various tools have been developed for adapting this confirmatory technique to exploratory uses (MacCallum, 1986). These include the use of modification indices and Lagrange multiplier tests for selectively adding parameters to a model, and the use of z statistics (also called critical ratios) and Wald tests for selectively eliminating parameters (Bentler, 1989; Jöreskog & Sörbom, 1996).
Amos provides an alternative approach to exploratory SEM. In this approach, exploratory SEM is treated as a problem in model selection in which the number of candidate models is permitted to be large. Amos's Specification Search provides a method for systematically specifying, fitting and evaluating a large number of candidate models. Tools are provided for choosing among the models on the basis of fit, parsimony, and interpretability.
In a Specification Search, some single- and double- headed arrows in a path diagram are designated as optional. Amos fits the model both with and without each optional arrow, using every possible subset of them. If only one arrow is optional then an exploratory analysis consists of fitting the model with and without that optional arrow. If there are, say, three optional arrows, the program fits the model eight times (that is, 23 times), using every possible subset of the optional arrows.
An analysis can be more or less exploratory, depending on how many arrows are optional. Of course, there is a practical limit to the number of optional arrows since each optional arrow doubles the number of models that need to be fitted.
###### Tools for model evaluation
When conducting a specification search, the primary concern is model comparison rather than the evaluation of a single model by itself. For the purpose of model comparison, Amos provides
- extensive tabular and graphic summaries of comparative model fit and its relationship to number of parameters
- rescaled versions of **AIC**, **BCC,** and **BIC**
- Akaike weights based on either **AIC** or **BCC**
- Bayes factors
- a scree test similar to the scree test used in factor analysis (Cattell, 1966)
Amos also provides additional statistics for evaluating models in absolute terms (as distinguished from model comparison). Amos fits alternative "null" or "baseline" models in addition to the usual zero-correlation baseline model. Each alternative baseline model gives rise to an alternative value for such fit measures as **CFI** that depend upon comparison to a baseline model.
###### Specification Search Window
*Help context ID: 11470*
The **Specification Search** window is used to systematically fit multiple models and to assist you in choosing among them on the basis of fit, parsimony, and interpretability.
See Examples 22 and 23 in the *User's Guide* for a tutorial on performing specification searches.
###### Specification Search toolbar
###### List of models
*Help context ID: 11490*
After you perform a specification search by clicking [](#t_performspecificationsearch), a list of models encountered during the search appears here. Click a column heading to sort the models. For example, click the BCC column to sort the models from best to worst according to **BCC**.
Within each column of fit measures, the best fit measure is underlined. For example, in the **BCC** column, the smallest value of **BCC** is underlined.
In the **Model** column, **Sat** refers to the saturated model. **Null 1**, **Null 2**, **Null 3** and **Null 4** refer to the four null, or baseline models described in [Appendix F](https://ai-docs.amosdevelopment.com/07-appendices.md#t_appendixfbaselinemodelsfordescriptivefitmeasures1).
###### Make arrows optional
*Help context ID: 11471*
When [](#t_makearrowsoptional) is in the pressed position, clicking individual arrows in the path diagram makes them optional parts of the model. The specification search will fit the model both with and without such optional arrows.
You can make several arrows optional by holding the left mouse button down and dragging the mouse pointer through the arrows.
###### Make arrows required
*Help context ID: 11472*
When [](#t_makearrowsrequired) is in the pressed position, clicking individual arrows in the path diagram makes them required parts of the model.
You can make several arrows required by holding the left mouse button down and dragging the mouse pointer through the arrows.
###### Perform specification search
*Help context ID: 11474*
Perform a specification search. Before performing a specification search, make sure to use [](#t_makearrowsoptional) to specify some arrows as optional.
###### Show all optional arrows
*Help context ID: 11475*
Make sure that all arrows that have been made optional with [](#t_makearrowsoptional) are visible.
###### Hide all optional arrows
*Help context ID: 11476*
Hide (i.e., make invisible) the arrows that have been made optional with [](#t_makearrowsoptional).
###### Show summary
*Help context ID: 11477*
After you perform a specification search by clicking [](#t_performspecificationsearch), click this button to show or hide the summary of models generated by the specification search. The summary shows a variety of fit measures for each model.
###### Decrease decimal places
*Help context ID: 11478*
Reduces by one the number of decimal places used in displaying numbers.
###### Increase decimal places
*Help context ID: 11479*
Shows one more digit of precision in displaying numbers.
###### Show short list
*Help context ID: 11480*
When this button is in the pressed position, display results for the best 1-parameter model, the best 2-parameter model, and so forth. When the button is in the unpressed position, display results for all models encountered during the specification search.
###### Show graphs
*Help context ID: 11481*
Show or hide a window that displays graphical summaries of model fit for the models encountered during the specification search.
###### Show path diagram
*Help context ID: 11482*
Displays the currently selected model as a path diagram in the Amos Graphics window.
First, click [](#t_performspecificationsearch) to perform a specification search. Then, select a model by clicking its row in the tabular summary of generated models. Finally, click [](#t_showpathdiagram) to display the model in the Amos Graphics window.
Alternatively, you can display a model in the Amos Graphics window by double-clicking it's row in the tabular summary of generated models.
###### Show parameter estimates on path diagram
*Help context ID: 11483*
When this button is in the pressed position, double-clicking a model in the tabular summary of generated models (or clicking the model and then clicking [](#t_showpathdiagram)) causes Amos Graphics to fit the model and to display the model's path diagram along with parameter estimates.
When this button is in the unpressed position, double-clicking a model in the tabular summary of generated models (or clicking the model and then clicking [](#t_showpathdiagram)) causes Amos Graphics to display the model's path diagram, without attempting to fit the model.
###### Options
*Help context ID: 11484*
Displays the **Options** window, which can be used to specify:
- how the results of the previous specification search are to be displayed.
- how the next specification search is to be performed.
- fonts and colors.
###### Save the current path diagram
*Help context ID: 11485*
Saves the path diagram along with the specification search results.
###### Copy rows to clipboard
*Help context ID: 11486*
Copies to the clipboard selected rows of the tabular summary of generated models.
###### Print
*Help context ID: 11487*
Prints the tabular summary of generated models.
###### Help
*Help context ID: 11488*
Displays online help for the **Specification Search** window.
###### About this program
*Help context ID: 11489*
Displays the version number and license information for Amos.
###### Options Window (Specification Search)
*Help context ID: 11400*
You can use the **Options** window to specify:
- how the results of the previous specification search are to be displayed
- how the next specification search is to be performed
- fonts and colors
###### Ignore inadmissibility and instability
*Help context ID: 11401*
This option affects the ordering of generated models when you sort the models according to some fit measure.
For example, suppose you sort the generated models according to **BCC** by clicking the **BCC** heading in the table of generated models. If the **Ignore inadmissibility and instability** option is checked, models are sorted according to **BCC** without regard to whether the models have admissible parameter estimates or stable linear systems. If the option is unchecked, models that have inadmissible parameter estimates or unstable linear systems are placed last in the ordering.
###### Show saturated model
*Help context ID: 11402*
If this option is checked, fit measures for the saturated model are displayed, provided that the saturated model was fitted during the previous specification search.
To make sure that the saturated model is fitted during specification searches, click the **Next search** tab in the **Options** window. Then, under the **Benchmark models** heading, put a check mark next to **Saturated**.
###### Show null models
*Help context ID: 11403*
If this option is checked, fit measures are displayed for any null models that were fitted during the previous specification search.
To choose which null, or baseline, models are fitted during specification searches, click the **Next search** tab in the **Options** window. Then, under the **Benchmark models** heading, put check marks next to any of **Null 1**, **Null 2**, **Null 3**, and **Null 4**.
See [Appendix F](https://ai-docs.amosdevelopment.com/07-appendices.md#t_appendixfbaselinemodelsfordescriptivefitmeasures1) for an explanation of the four null models.
###### Keep on top
*Help context ID: 11404*
Keeps the **Options** window on top of other windows.
###### Raw
*Help context ID: 11405*
Displays **BCC**, **AIC** and **BIC** as they are defined in [Appendix C](https://ai-docs.amosdevelopment.com/07-appendices.md#t_appendixcmeasuresoffit1).
###### Zero-based (min = 0)
*Help context ID: 11406*
Rescales **BCC**, **AIC** and **BIC** so that the rescaled values are either zero or positive. The best model according to, say, **AIC** has **AIC**0 = 0 while inferior models have positive **AIC**0 values that reflect how much worse they are than the best model.
See also [Zero-based re-scaling](https://ai-docs.amosdevelopment.com/07-appendices.md#t_zerobasedrescaling1).
###### Akaike weights / Bayes factors (max = 1)
*Help context ID: 11407*
See [Appendix G](https://ai-docs.amosdevelopment.com/07-appendices.md#t_appendixgrescalingofaicbccandbic)
###### Akaike weights / Bayes factors (sum = 1)
*Help context ID: 11408*
See [Appendix G](https://ai-docs.amosdevelopment.com/07-appendices.md#t_appendixgrescalingofaicbccandbic)
###### Display
*Help context ID: 11409*
Put check marks next to the items that you want displayed for each model encountered during specification searches. The available items are
- [Model number](#t_modelnumber)
- [Model name](#t_modelname2)
- [Params](#t_params)
- [df](#t_df3)
- [C](#t_c)
- [C - df](#t_cdf)
- **AIC**: One of the following, depending on your selection under the heading **BCC, AIC, BIC** on the **Current results** tab in the **Options** window.
- [Raw AIC](#t_rawaic)
- [Zero-based AIC](#t_zerobasedaic)
- [Akaike weights based on AIC (max = 1)](#t_akaikeweightsbasedonaicmax1)
- [Akaike weights based on AIC (sum = 1)](#t_akaikeweightsbasedonaicsum1)
- **BCC**: One of the following, depending on your selection under the heading **BCC, AIC, BIC** on the **Current results** tab in the **Options** window.
- [Raw BCC](#t_rawbcc)
- [Zero-based BCC](#t_zerobasedbcc)
- [Akaike weights based on BCC (max = 1)](#t_akaikeweightsbasedonbccmax1)
- [Akaike weights based on BCC (sum = 1)](#t_akaikeweightsbasedonbccsum1)
- **BIC**: One of the following, depending on your selection under the heading **BCC, AIC, BIC** on the **Current results** tab in the **Options** window.
- [Raw BIC](#t_rawbic)
- [Zero-based BIC](#t_zerobasedbic)
- [Bayes factors (max = 1)](#t_bayesfactorsmax1)
- [Bayes factors (sum = 1)](#t_bayesfactorssum1)
- [C / df](#t_cdf1)
- [p](#t_p3)
- [Notes](#t_notes)
- **Derived fit indices**: The following fit measures
- [RMSEA](#t_rmsea3)
- [CFI based on null model 1](#t_cfibasedonnullmodel1) (Displayed only if there was a check mark next to **Null 1** on the **Next search** tab of the **Options** window during the previous specification search)
- [CFI based on null model 2](#t_cfibasedonnullmodel2) (Displayed only if there was a check mark next to **Null 2** on the **Next search** tab of the **Options** window during the previous specification search)
- [CFI based on null model 3](#t_cfibasedonnullmodel3) (Displayed only if there was a check mark next to **Null 3** on the **Next search** tab of the **Options** window during the previous specification search)
- [CFI based on null model 4](#t_cfibasedonnullmodel4) (Displayed only if there was a check mark next to **Null 4** on the **Next search** tab of the **Options** window during the previous specification search)
###### Model number
*Help context ID: 11500*
An arbitrary number that is assigned to models as they are encountered during a specification search. Model numbers depend in part on the order in which the objects in the path diagram were drawn.
Click the **Model number** column heading to sort the models according to model number.
###### Model name
*Help context ID: 11502*
The **Model name** column is only displayed for specification searches in which multiple models were specified and named in Amos Graphics through use of the [Manage models](#t_managemodels) tool, or in an Amos program through use of the [Model](https://ai-docs.amosdevelopment.com/05-programming-with-amos-part-2.md#t_modelmethod) method.
Click the **Model name** column heading to sort the models alphabetically according to model name.
###### Params
*Help context ID: 11504*
The number of distinct parameters. If two or more parameters are constrained to be equal, they count as a single parameter.
Click the **Params** column heading to sort the models according to number of parameters.
###### C
*Help context ID: 11506*
The minimum value of the discrepancy function (see [Appendix B](https://ai-docs.amosdevelopment.com/07-appendices.md#t_appendixbdiscrepancyfunctions1)). Elsewhere in Amos output, the minimum value of the discrepancy function is sometimes referred to as **CMIN**.
Click the **C** column heading to sort the models according to the minimum value of the discrepancy function.
###### df
*Help context ID: 11508*
Degrees of freedom.
Click the **df** column heading to sort the models according to degrees of freedom.
###### p
*Help context ID: 11510*
A "[p-value](https://ai-docs.amosdevelopment.com/07-appendices.md#t_p2)". The probability that a correct model would fit as badly as the fitted model does.
Click the **p** column heading to sort the models according to p-value.
###### Raw BCC
*Help context ID: 11512*
Displays **BCC** as defined in [Appendix C](https://ai-docs.amosdevelopment.com/07-appendices.md#t_appendixcmeasuresoffit1).
Click the **BCC** column heading to sort the models according to **BCC**.
###### Zero-based BCC
*Help context ID: 11513*
To calculate **BCC**0, a constant is added to each model's raw **BCC** so that the best model (according to **BCC**) has **BCC**0 = 0 while inferior models have positive **BCC**0 values that reflect how much worse they are than the best model.
See [Zero-based re-scaling](https://ai-docs.amosdevelopment.com/07-appendices.md#t_zerobasedrescaling1).
Click the **BCC**0 column heading to sort the models according to **BCC**0.
###### Akaike weights based on BCC (max = 1)
*Help context ID: 11514*
The **BCC**L are Akaike weights ([Burnham & Anderson, 2002](https://ai-docs.amosdevelopment.com/08-references.md#t_burnham__anderson_2002)) with **BCC** substituted for **AIC**, and
multiplied by a constant so that the best model (according to **BCC**) has **BCC**L = 1.
See [Akaike weights and Bayes factors (max = 1)](https://ai-docs.amosdevelopment.com/07-appendices.md#t_akaikeweightsandbayesfactorsmax11).
Click the **BCC**L column heading to sort the models according to **BCC**L.
###### Akaike weights based on BCC (sum = 1)
*Help context ID: 11515*
The **BCC**p are Akaike weights ([Burnham & Anderson, 2002](https://ai-docs.amosdevelopment.com/08-references.md#t_burnham__anderson_2002)), with **BCC** substituted for **AIC**.
See [Akaike weights and Bayes factors (sum = 1)](https://ai-docs.amosdevelopment.com/07-appendices.md#t_akaikeweightsandbayesfactorssum11).
Click the **BCC**p column heading to sort the models according to **BCC**p.
###### Raw AIC
*Help context ID: 11516*
The **AIC** column displays **AIC** as defined in [Appendix C](https://ai-docs.amosdevelopment.com/07-appendices.md#t_appendixcmeasuresoffit1).
Click the **AIC** column heading to sort the models according to **AIC**.
###### Zero-based AIC
*Help context ID: 11517*
To calculate **AIC**0, a constant is added to each model's raw **AIC** so that the best model (according to **AIC**) has **AIC**0 = 0 while inferior models have positive **AIC**0 values that reflect how much worse they are than the best model.
See [Zero-based re-scaling](https://ai-docs.amosdevelopment.com/07-appendices.md#t_zerobasedrescaling1).
Click the **AIC**0 column heading to sort the models according to **AIC**0.
###### Akaike weights based on AIC (max = 1)
*Help context ID: 11518*
The **AIC**L are Akaike weights ([Burnham & Anderson, 2002](https://ai-docs.amosdevelopment.com/08-references.md#t_burnham__anderson_2002)), multiplied by a constant so that the best model (according to **AIC**) has **AIC**L = 1.
See [Akaike weights and Bayes factors (max = 1)](https://ai-docs.amosdevelopment.com/07-appendices.md#t_akaikeweightsandbayesfactorsmax11).
Click the **AIC**L column heading to sort the models according to **AIC**L.
###### Akaike weights based on AIC (sum = 1)
*Help context ID: 11519*
The **AIC**p are Akaike weights ([Burnham & Anderson, 2002](https://ai-docs.amosdevelopment.com/08-references.md#t_burnham__anderson_2002)).
See [Akaike weights and Bayes factors (sum = 1)](https://ai-docs.amosdevelopment.com/07-appendices.md#t_akaikeweightsandbayesfactorssum11).
Click the **AIC**p column heading to sort the models according to **AIC**p.
###### Raw BIC
*Help context ID: 11520*
Displays **BIC** as defined in [Appendix C](https://ai-docs.amosdevelopment.com/07-appendices.md#t_appendixcmeasuresoffit1).
Click the **BIC** column heading to sort the models according to **BIC**.
###### Zero-based BIC
*Help context ID: 11521*
To calculate **BIC**0, a constant is added to each model's raw **BIC** so that the best model (according to **BIC**) has **BIC**0 = 0 while inferior models have positive **BIC**0 values that reflect how much worse they are than the best model.
See [Zero-based re-scaling](https://ai-docs.amosdevelopment.com/07-appendices.md#t_zerobasedrescaling1).
Click the **BIC**0 column heading to sort the models according to **BIC**0.
###### Bayes factors (max = 1)
*Help context ID: 11522*
The **BIC**L are approximate Bayes factors ([Burnham & Anderson, 2002](https://ai-docs.amosdevelopment.com/08-references.md#t_burnham__anderson_2002); [Madigan & Raftery, 1994](https://ai-docs.amosdevelopment.com/08-references.md#t_madigan__raftery_1994); [Raftery, 1995](https://ai-docs.amosdevelopment.com/08-references.md#t_raftery_1995)), multiplied by a constant so that the best model (according to **BIC**) has **BIC**L = 1.
See [Akaike weights and Bayes factors (max = 1)](https://ai-docs.amosdevelopment.com/07-appendices.md#t_akaikeweightsandbayesfactorsmax11).
Click the **BIC**L column heading to sort the models according to **BIC**L.
###### Bayes factors (sum = 1)
*Help context ID: 11523*
The **BIC**p are approximate Bayes factors ([Burnham & Anderson, 2002](https://ai-docs.amosdevelopment.com/08-references.md#t_burnham__anderson_2002); [Madigan & Raftery, 1994](https://ai-docs.amosdevelopment.com/08-references.md#t_madigan__raftery_1994); [Raftery, 1995](https://ai-docs.amosdevelopment.com/08-references.md#t_raftery_1995)).
See [Akaike weights and Bayes factors (sum = 1)](https://ai-docs.amosdevelopment.com/07-appendices.md#t_akaikeweightsandbayesfactorssum11).
Click the **BIC**p column heading to sort the models according to **BIC**p.
###### C - df
*Help context ID: 11524*
The minimum discrepancy,
$\hat{C}$, (see [Appendix B](https://ai-docs.amosdevelopment.com/07-appendices.md#t_appendixbdiscrepancyfunctions1)) minus its degrees of freedom. When C - df is nonnegative, it is known as the [noncentrality parameter](https://ai-docs.amosdevelopment.com/07-appendices.md#t_ncp2), or NCP.
###### C / df
*Help context ID: 11526*
The minimum discrepancy,
$\hat{C}$, (see [Appendix B](https://ai-docs.amosdevelopment.com/07-appendices.md#t_appendixbdiscrepancyfunctions1)) divided by its degrees of freedom. See [CMIN/DF](https://ai-docs.amosdevelopment.com/07-appendices.md#t_cmindf1).
###### Notes
*Help context ID: 11528*
The **Notes** column annotates models that have inadmissible parameter estimates or unstable linear systems.
###### RMSEA
*Help context ID: 11530*
[RMSEA](https://ai-docs.amosdevelopment.com/07-appendices.md#t_rmsea2)
###### CFI based on null model 1
*Help context ID: 11531*
[CFI](https://ai-docs.amosdevelopment.com/07-appendices.md#t_cfi2) calculated using null (baseline) model 1 (see [Appendix F](https://ai-docs.amosdevelopment.com/07-appendices.md#t_appendixfbaselinemodelsfordescriptivefitmeasures1)).
###### CFI based on null model 2
*Help context ID: 11532*
[CFI](https://ai-docs.amosdevelopment.com/07-appendices.md#t_cfi2) calculated using null (baseline) model 2 (see [Appendix F](https://ai-docs.amosdevelopment.com/07-appendices.md#t_appendixfbaselinemodelsfordescriptivefitmeasures1)).
###### CFI based on null model 3
*Help context ID: 11533*
[CFI](https://ai-docs.amosdevelopment.com/07-appendices.md#t_cfi2) calculated using null (baseline) model 3 (see [Appendix F](https://ai-docs.amosdevelopment.com/07-appendices.md#t_appendixfbaselinemodelsfordescriptivefitmeasures1)).
###### CFI based on null model 4
*Help context ID: 11534*
[CFI](https://ai-docs.amosdevelopment.com/07-appendices.md#t_cfi2) calculated using null (baseline) model 4 (see [Appendix F](https://ai-docs.amosdevelopment.com/07-appendices.md#t_appendixfbaselinemodelsfordescriptivefitmeasures1)).
###### Reset
*Help context ID: 11410*
Restores the **Specification Search** options to their factory defaults.
###### Number of models to be fitted
*Help context ID: 11411*
The number of models that will be fitted during the next specification search, not counting the saturated model or any null (baseline) models that are to be fitted. If you have selected **Stepwise** as the search algorithm, the number of models that will be fitted on each pass of the stepwise procedure is displayed.
###### Forward
*Help context ID: 11412*
Performs a heuristic search in which the program first fits the model with no optional arrows. Then it adds one optional arrow at a time, always adding whichever arrow gives the largest reduction in discrepancy.
###### Backward
*Help context ID: 11413*
Performs a heuristic search in which the program first fits the model with all optional arrows in the model. Then it removes one optional arrow at a time, always removing whichever arrow gives the smallest increase in discrepancy.
###### Stepwise
*Help context ID: 11414*
Performs a heuristic search in which the program alternates between **Forward** and **Backward** searches, beginning with a **Forward** search. The program keeps track of the best 1-optional-arrow model encountered, the best 2-optional-arrow model, and so on. After the first **Forward** search, the **Forward** and **Backward** search algorithms are modified by the following rule: The program will add an arrow or remove an arrow only if the resulting model has a smaller discrepancy than any previously encountered model with the same number of arrows. For example, the program will add an arrow to a 5-optional-arrow model only if the resulting 6-optional-arrow model has a smaller discrepancy than any previously encountered 6-optional-arrow model. **Forward** and **Backward** searches are alternated until one **Forward** or **Backward** search is completed with no improvement.
###### Simulated annealing
*Help context ID: 11415*
Simulated annealing is not implemented.
###### All subsets
*Help context ID: 11416*
Performs an exhaustive search.
###### Use no more than ____ optional parameters.
*Help context ID: 11417*
Restrict the next specification search to models that have no more than the specified number of optional arrows.
###### Retain only the best ____ models.
*Help context ID: 11418*
Limits the number of models for which fit measures will be retained and reported. For example, if you specify **Retain only the best 10 models**, the next specification search will retain and report fit measures for no more than 10 1-parameter models, no more than 10 2- parameter models, and so on. To remove any limitation on the number of models reported, specify **Retain only the best 0 models**.
Limiting the number of models reported can speed up a specification search significantly. At the present writing, it is not practical to retain and report fit measures for more than about 4000 models, although the number of models fitted during a specification search can be much larger than that.
Specifying a non-zero value for **Retain only the best ___ models** prevents the program from normalizing Akaike weights and Bayes factors so that they sum to one across all models.
###### Benchmark models
*Help context ID: 11424*
Benchmark models are employed by several measures of fit as standards against which other models can be compared. The available models consist of the saturated model, which is guaranteed to have a minimum discrepancy as small as that for any other model, and four null models (Null 1, Null 2, Null 3 and Null 4) that typically fit badly.
###### Saturated
*Help context ID: 11419*
When the data contain missing values, the **Saturated** option affects whether the saturated model is fitted. If **Saturated** is checked, the saturated model will be fitted. With complete data, the saturated model is always fitted.
With incomplete data, the null models (**Null 1**, **Null 2**, **Null 3** and **Null 4**) are fitted only when the saturated model is fitted.
For maximum likelihood ([Ml](https://ai-docs.amosdevelopment.com/05-programming-with-amos-part-2.md#t_mlmethod)), generalized least squares ([Gls](https://ai-docs.amosdevelopment.com/05-programming-with-amos-part-2.md#t_glsmethod)) and asymptotically distribution-free ([Adf](https://ai-docs.amosdevelopment.com/04-programming-with-amos-part-1.md#t_adfmethod)) estimation, fitting the saturated model is necessary for calculating the chi square statistic and all of the fit measures that depend on the chi square statistics.
With incomplete data, it is not practical to fit the saturated model if the number of observed variables is very large. For this reason, the specification search routine does not fit the saturated model or any of the null models if the number of observed variables exceeds 20 and the data contain missing values.
###### Null model 1
*Help context ID: 11420*
If **Null 1** is checked, the **Null 1** model will be fitted and used to calculate **CFI**1 for each model generated by the specification search.
With incomplete data, both **Saturated** and **Null 1** must be checked in order to fit the **Null 1** model and to calculate **CFI**1.
In the **Null 1** model, the observed variables are required to be uncorrelated. Their means and variances are unconstrained. This is the baseline "Independence" model in an ordinary Amos analysis when you do not perform a specification search. (See [Appendix F](https://ai-docs.amosdevelopment.com/07-appendices.md#t_appendixfbaselinemodelsfordescriptivefitmeasures1) for more about null models.)
###### Null model 2
*Help context ID: 11421*
If **Null 2** is checked, the **Null 2** model will be fitted and used to calculate **CFI**2 for each model generated by the specification search.
With incomplete data, both **Saturated** and **Null 2** must be checked in order to fit the **Null 2** model and to calculate **CFI**2.
In the **Null 2** model, the correlations among the observed variables are required to be equal. The means and variances of the observed variables are unconstrained. (See [Appendix F](https://ai-docs.amosdevelopment.com/07-appendices.md#t_appendixfbaselinemodelsfordescriptivefitmeasures1) for more about null models.)
###### Null model 3
*Help context ID: 11422*
If **Null 3** is checked, the **Null 3** model will be fitted and used to calculate **CFI**3 for each model generated by the specification search.
With incomplete data, both **Saturated** and **Null 3** must be checked in order to fit the **Null 3** model and to calculate **CFI**3.
In the **Null 3** model, the observed variables are required to be uncorrelated and to have zero means. Their variances are unconstrained. This is the baseline "Independence" model used by Amos 4.0.1 and earlier for models where means and intercepts are explicit model parameters. (See [Appendix F](https://ai-docs.amosdevelopment.com/07-appendices.md#t_appendixfbaselinemodelsfordescriptivefitmeasures1) for more about null models.)
There is little reason to fit the **Null 3** model in the common situation where means and intercepts are not constrained, but are estimated for the sole purpose of allowing maximum likelihood estimation with missing data.
The **Null 3** option is enabled only for models in which means and intercepts are explicit model parameters.
###### Null model 4
*Help context ID: 11423*
If **Null 4** is checked, the **Null 4** model will be fitted and used to calculate **CFI**4 for each model generated by the specification search.
With incomplete data, both **Saturated** and **Null 4** must be checked in order to fit the **Null 4** model and to calculate **CFI**4.
In the **Null 4** model, the correlations among the observed variables are required to be equal. The variances of the observed variables are unconstrained. Their means are required to be zero. (See [Appendix F](https://ai-docs.amosdevelopment.com/07-appendices.md#t_appendixfbaselinemodelsfordescriptivefitmeasures1) for more about null models.)
There is little reason to fit the **Null 4** model in the common situation where means and intercepts are not constrained, but are estimated for the sole purpose of allowing maximum likelihood estimation with missing data.
The **Null 4** option is enabled only for models in which means and intercepts are explicit model parameters.
###### Font
*Help context ID: 11443*
Specifies the font used for the tabular summary of models encountered during the specification search.
###### Text color
*Help context ID: 11444*
Specifies the color of text in the tabular summary of models encountered during the specification search.
###### Background color
*Help context ID: 11445*
Specifies the background color of the tabular summary of models encountered during the specification search.
###### Line color
*Help context ID: 11446*
Specifies the color of optional arrows.
To use dotted lines for displaying optional arrows, click **View**®**Interface Properties**®**Accessibility** on the Amos Graphics menu and put a check mark next to **Alternative to color**.
###### Search Progress window
The **Search Progress** window is displayed after you click [](#t_performspecificationsearch) to initiate a specification search. It displays the amount of time the specification search has taken so far, an estimate of time remaining, and an estimate of the time of completion.
###### Progress bar
*Help context ID: 11458*
Displays a visual indicator of the specification search's progress. In the case of a **Stepwise** search, the progress bar shows the progress of the current pass of the stepwise procedure.
###### Elapsed time
*Help context ID: 11451*
Time spent on the specification search so far.
###### Remaining time
*Help context ID: 11452*
An estimate of how much longer the specification search will take.
###### Estimated completion
*Help context ID: 11453*
The approximate time when the specification search will be complete.
###### Close this dialog when search is complete
*Help context ID: 11454*
If this box is checked when the specification search terminates, the **Search Progress** window closes automatically. Otherwise, the window remains open until you click the **Close** button.
###### Cancel
*Help context ID: 11455*
Terminates the specification search.
###### Close
*Help context ID: 11456*
Closes the **Search Progress** window.
###### Hide
*Help context ID: 11457*
Minimizes the **Search Progress** window and the **Specification Search** window. A button on the taskbar displays the approximate percentage of the specification search that has been completed.
###### Plot window
*Help context ID: 11430*
The **Plot** window provides several ways to graphically display the results of a specification search.
###### Plot type
*Help context ID: 11441*
Select the type of graph to display. The choices are:
- [Scatter](#t_scatter)
- [Best fit](#t_bestfit)
- [Scree](#t_scree)
###### Scatter
*Help context ID: 11630, 11431*
Displays a scatterplot of fit (measured by C, the minimum value of the discrepancy function) versus complexity (measured by number of parameters) where each point represents a model.
The scatterplot portrays the tradeoff between fit and complexity that Steiger characterized as follows:
"In the final analysis, it may be, in a sense, impossible to define one *best* way to combine measures of complexity and measures of badness-of-fit in a single numerical index, because the precise nature of the *best* numerical tradeoff between complexity and fit is, to some extent, a matter of personal taste. The choice of a model is a classic problem in the two-dimensional analysis of preference." ([Steiger, 1990](https://ai-docs.amosdevelopment.com/08-references.md#t_steiger_1990), p. 179.)
For an explanation of the straight line that passes through the scatterplot, right-click the **Fit values** panel and select **What's This?** from the popup menu.
###### Best fit
*Help context ID: 11650, 11432*
Displays a "best fit" graph. Each point in the graph represents a model that fits as well as or better than any other model that has the same number of parameters.
In the following example, the best 16-parameter model has C = 67.342. The best 17-parameter model has C = 3.071. And so on.
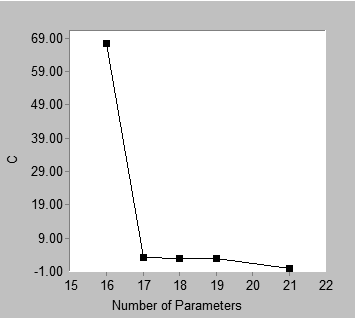
Note that the best model for a fixed number of parameters does not depend on the choice of fit measure.
Clicking different fit measures under the **Fit measures** heading changes the vertical axis of the best fit graph and changes the shape of the configuration of points. However the points in the best fit graph always represent the same set of models regardless of the choice of fit measure.
###### Scree
*Help context ID: 11640, 11433*
Displays a "scree plot". A scree plot shows first order differences in the "best fit" graph. Below is an example of a best fit graph and the corresponding scree plot.
| 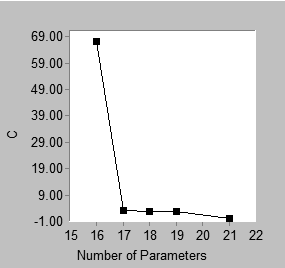 | 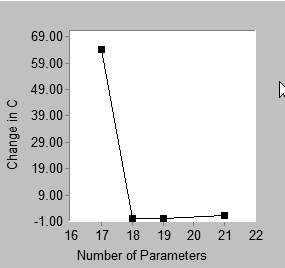 |
| --- | --- |
| Best fit | Scree |
The best fit graph shows that the best 16-parameter model has C = 67.342 while the best 17-parameter model has C = 3.071. That is, the best 17-parameter model fits better than the best 16-parameter model, with the difference being 67.342 - 3.071 = 64.271. This difference appears in the scree plot, where the point with coordinate 17 on the horizontal axis has coordinate 64.271 on the vertical axis. Similarly, the height of the scree plot at 18 parameters shows the improvement in C obtained by moving from the best 17-parameter model to the best 18-parameter model, and so on. The point located above 21 on the horizontal axis of the scree plot requires a separate explanation. In this example, there is no 20-parameter model with which the best 21-parameter model can be compared. The best 21-parameter model (with C = 0) is therefore compared to the best 19-parameter model (with C = 2.761). The height of the 21-parameter point in the scree plot is calculated as (2.761 – 0)/2. That is, the improvement in C obtained by moving from the best 19-parameter model to the best 21-parameter model is expressed as the amount of reduction in C *per parameter*.
In the above example, either the best fit graph or the scree plot can be used to support a heuristic "point of diminishing returns" argument in favor of 17 parameters. There is this difference: in the best fit graph, one looks for an "elbow" in the graph, or a place where the slope changes from relatively steep to relatively flat. For the present problem, this occurs at 17 parameters, which can be taken as support for the best 17-parameter model. In the scree plot, one also looks for an elbow, but the elbow occurs at 18 parameters in this example. This is also taken as support for the best 17-parameter model. In a scree plot an elbow at *k* parameters provides support for the best (*k*-1)-parameter model.
The scree plot is so named because of its similarity to the graph known as a scree plot in principal components analysis ([Cattell, 1966](https://ai-docs.amosdevelopment.com/08-references.md#t_cattell_1966)). In principal components analysis, a scree plot shows the improvement in model fit that is obtained by adding components to the model, one component at a time. The scree plot presented here for SEM shows the improvement in model fit that is obtained by incrementing the number of model parameters. The scree plot for SEM is not identical in all respects to the scree plot for principal components analysis. For example, in principal components one obtains a sequence of nested models when introducing components one at a time. This is not necessarily the case in the scree plot for SEM. The best 17-parameter model, say, and the best 18-parameter model may or may not be nested. Furthermore, in principal components, the scree plot is always monotone non- increasing, which is not guaranteed in the case of the scree plot for SEM, even with nested models. Indeed, the scree plot for the present example is not monotone.
In spite of the differences between the traditional scree plot and the scree plot presented here, it is proposed that the new scree plot be used in the same heuristic fashion as the traditional one. A two-stage approach to model selection is suggested. In the first stage, the number of parameters is selected by examining either the scree plot or the short list of models. In the second stage, the best model is chosen from among those models that have the number of parameters determined in the first stage.
###### Fit measure
*Help context ID: 11442*
When **Best fit** or **Scree** is selected under **Plot type**, your choice here specifies the fit measure to be represented by the vertical axis.
When **Scatter** is selected under **Plot type**, your choice here specifies which fit measures are to be displayed in the **Fit values** panel. The vertical axis always represents [C](https://ai-docs.amosdevelopment.com/07-appendices.md#t_cmin2) when **Scatter** is selected.
###### C (Plot window)
*Help context ID: 11434*
When **Best fit** or **Scree** has been selected under **Plot type**, display [C](https://ai-docs.amosdevelopment.com/07-appendices.md#t_cmin2) on the vertical axis.
When **Scatter** has been selected under **Plot type**, display [C](https://ai-docs.amosdevelopment.com/07-appendices.md#t_cmin2), [F](https://ai-docs.amosdevelopment.com/07-appendices.md#t_fmin2) and [NFI](https://ai-docs.amosdevelopment.com/07-appendices.md#t_nfi2) in the **Fit values** panel.
###### C - df (Plot window)
*Help context ID: 11435*
When **Best fit** or **Scree** has been selected under **Plot type**, display **C - df** on the vertical axis.
When **Scatter** has been selected under **Plot type**, display **C - df**, [NCP](https://ai-docs.amosdevelopment.com/05-programming-with-amos-part-2.md#t_ncpncploncphimethods), [F0](https://ai-docs.amosdevelopment.com/07-appendices.md#t_f02) and [CFI](https://ai-docs.amosdevelopment.com/07-appendices.md#t_cfi2) in the **Fit values** panel.
###### AIC (Plot window)
*Help context ID: 11436*
When **Best fit** or **Scree** has been selected under **Plot type**, display [AIC](https://ai-docs.amosdevelopment.com/07-appendices.md#t_aic2) on the vertical axis.
When **Scatter** has been selected under **Plot type**, display [AIC](https://ai-docs.amosdevelopment.com/07-appendices.md#t_aic2) in the **Fit values** panel.
###### BCC (Plot window)
*Help context ID: 11437*
When **Best fit** or **Scree** has been selected under **Plot type**, display [BCC](https://ai-docs.amosdevelopment.com/07-appendices.md#t_bcc2) on the vertical axis.
When **Scatter** has been selected under **Plot type**, display [BCC](https://ai-docs.amosdevelopment.com/07-appendices.md#t_bcc2) in the **Fit values** panel.
###### BIC (Plot window)
*Help context ID: 11438*
When **Best fit** or **Scree** has been selected under **Plot type**, display [BIC](https://ai-docs.amosdevelopment.com/07-appendices.md#t_bic2) on the vertical axis.
When **Scatter** has been selected under **Plot type**, display [BIC](https://ai-docs.amosdevelopment.com/07-appendices.md#t_bic2) in the **Fit values** panel.
###### C / df (Plot window)
*Help context ID: 11439*
When **Best fit** or **Scree** has been selected under **Plot type**, display **C / df** on the vertical axis.
When **Scatter** has been selected under **Plot type**, display **C / df**, [RMSEA](https://ai-docs.amosdevelopment.com/05-programming-with-amos-part-2.md#t_rmsearmsealormseahimethods), [RFI](https://ai-docs.amosdevelopment.com/07-appendices.md#t_rfi2) and [TLI](https://ai-docs.amosdevelopment.com/07-appendices.md#t_tli2) in the **Fit values** panel.
###### Fit values
*Help context ID: 11440*
Fit values
###### Values of C and monotonically related fit measures
*Help context ID: 11660*
The **Fit values** box shows the value of [C](https://ai-docs.amosdevelopment.com/07-appendices.md#t_cmin2) for points on the solid line that passes through the scatterplot, as well as the corresponding value of [F](https://ai-docs.amosdevelopment.com/07-appendices.md#t_fmin2). In addition, as many as four values for [NFI](https://ai-docs.amosdevelopment.com/07-appendices.md#t_nfi2) may be shown depending on which baseline models are available for calculating **NFI**.
When you move the line that passes through the scatterplot by dragging it with the mouse, the values in the **Fit values** box are updated.
###### Values of C - df and monotonically related fit measures
*Help context ID: 11661*
Values of C – df and monotonically related fit measures
The **Fit values** box shows the value of **C - df** for points on the solid line that passes through the scatterplot, as well as corresponding values of:
- [NCP](https://ai-docs.amosdevelopment.com/05-programming-with-amos-part-2.md#t_ncpncploncphimethods), the noncentrality parameter estimate
- [F0](https://ai-docs.amosdevelopment.com/07-appendices.md#t_f02), the estimate of the population value of F
- [CFI](https://ai-docs.amosdevelopment.com/07-appendices.md#t_cfi2), calculated separately for each null model.
When you move the line that passes through the scatterplot by dragging it with the mouse, the values in the **Fit values** box are updated.
###### Value of AIC
*Help context ID: 11662*
The **Fit values** box shows the value of [AIC](https://ai-docs.amosdevelopment.com/07-appendices.md#t_aic2) for points on the solid line that passes through the scatterplot.
When you move the line that passes through the scatterplot by dragging it with the mouse, the **AIC** value in the **Fit values** box is updated.
###### Value of BCC
*Help context ID: 11663*
The **Fit values** box shows the value of [BCC](https://ai-docs.amosdevelopment.com/07-appendices.md#t_bcc2) for points on the solid line that passes through the scatterplot.
When you move the line that passes through the scatterplot by dragging it with the mouse, the **BCC** value in the **Fit values** box is updated.
###### Value of BIC
*Help context ID: 11664*
The **Fit values** box shows the value of [BIC](https://ai-docs.amosdevelopment.com/07-appendices.md#t_bic2) for points on the solid line that passes through the scatterplot.
When you move the line that passes through the scatterplot by dragging it with the mouse, the **BIC** value in the **Fit values** box is updated.
###### Values of C / df and monotonically related fit measures
*Help context ID: 11665*
The **Fit values** box shows the value of **C / df** for points on the solid line that passes through the scatterplot, as well as corresponding values of:
- [RMSEA](https://ai-docs.amosdevelopment.com/05-programming-with-amos-part-2.md#t_rmsearmsealormseahimethods)
- [RFI](https://ai-docs.amosdevelopment.com/07-appendices.md#t_rfi2), calculated separately for each null model
- [TLI](https://ai-docs.amosdevelopment.com/07-appendices.md#t_tli2), calculated separately for each null model
When you move the line that passes through the scatterplot by dragging it with the mouse, the values in the **Fit values** box are updated.
###### Fit measures are displayed here only for Scatter plots.
*Help context ID: 11670, 11671, 11672, 11673, 11674, 11675, 11680, 11681, 11682, 11683, 11684, 11685*
The **Fit values** box is used only when **Scatter** is selected for **Plot type**.
##### Multiple-group analysis
*Help context ID: 108*
Menu: **Analyze****®****Multiple-Group Analysis...**
This button opens the [Multiple-Group Analysis window](#t_multiplegroupanalysiswindow).
###### Multiple-Group Analysis window
*Help context ID: 11000*
The **Multiple-Group Analysis** window is used to fit a model simultaneously to multiple groups. Cross-group constraints are automatically created in a way consistent with the recommendations of [Bollen (1989a)](https://ai-docs.amosdevelopment.com/08-references.md#t_bollen_1989a), [Byrne (2016)](https://ai-docs.amosdevelopment.com/08-references.md#t_byrne_2001), [Kline (2016)](https://ai-docs.amosdevelopment.com/08-references.md#t_kline_2005) and others.
When you have data from multiple groups, you often start by asking if it is necessary to draw a separate path diagram for each group, or if the same path diagram will do for all groups. If you conclude that all the groups share the same path diagram, you can proceed to ask whether parameter values are invariant across groups. For example, if you are studying boys and girls, you might want to know whether boys and girls have the same regression weights, or if only certain regression weights are the same for boys and girls. Of course there are also variances and covariances as well as regression weights to consider. Because of the large number of possible cross-group constraints, it is necessary to have a strategy for deciding which cross-group constraints are worth testing and in what order to test them. Bollen (1989), Kline (1998), and others discuss such strategies. Amos implements an automatic procedure for generating a nested hierarchy of models in which cross-group constraints are introduced incrementally in a pre-chosen order.
No automatic procedure can anticipate the purpose of every individual study. If necessary, you can modify Amos's automatically generated cross-group constraints to suit the needs of an individual study. However, no such customization will be necessary in most cases. You also have the option of performing multiple-group analyses by imposing cross-group constraints manually.
See Examples 24 and 25 in the *User's Guide* for a tutorial on performing multiple-group analyses with automatically generated cross-group constraints.
###### Parameter Subsets
*Help context ID: 11018*
Model parameters are grouped into the following categories.
- [Measurement weights](#t_measurementweights)
- [Measurement intercepts](#t_measurementintercepts)
- [Structural weights](#t_structuralweights)
- [Structural intercepts](#t_structuralintercepts)
- [Structural means](#t_structuralmeans)
- [Structural covariances](#t_structuralcovariances)
- [Structural residuals](#t_structuralresiduals)
- [Measurement residuals](#t_measurementresiduals)
In specifying parameter constraints , you can choose whether parameters within a category are allowed to take on different values for different groups, or if they are required to have the same value for every group. For example, in a factor analysis model, the **Measurement weights** category consists of the regression weights used in predicting measured variables from latent variables. You can choose whether those regression weights are constrained to be equal across groups, or are allowed to have different values for different groups.
###### Measurement weights
*Help context ID: 11010*
Measurement weights are regression weights in the measurement part of the model. In the case of a factor analysis model, these are the "factor loadings".
For models that have no measurement weights, the **Measurement weights** caption is disabled.
Click the **Measurement weights** caption to display the measurement weights in color in the Amos Graphics window. If you have previously selected **Alternative to color** (See [To change accessibility settings](https://ai-docs.amosdevelopment.com/03-amos-graphics-reference-guide-part-2.md#t_tochangeaccessibilityoptions)), the measurement weights are drawn with extra-thick lines in the Amos Graphics window.
###### Measurement intercepts
*Help context ID: 11011*
Measurement intercepts are intercepts in the equations for predicting measured variables. For models that have no measurement intercepts, the **Measurement intercepts** caption is disabled.
Click the **Measurement intercepts caption** to display the measured endogenous variables in color in the Amos Graphics window. If you have previously selected **Alternative to color** (See [To change accessibility settings](https://ai-docs.amosdevelopment.com/03-amos-graphics-reference-guide-part-2.md#t_tochangeaccessibilityoptions)), the measured endogenous variables are drawn with extra-thick lines in the Amos Graphics window.
###### Structural weights
*Help context ID: 11012*
Structural weights are regression weights in the structural part of the model.
For models that have no structural weights, the **Structural weights** caption is disabled.
Click the **Structural weights** caption to display the structural weights in color in the Amos Graphics window. If you have previously selected **Alternative to color** (See [To change accessibility settings](https://ai-docs.amosdevelopment.com/03-amos-graphics-reference-guide-part-2.md#t_tochangeaccessibilityoptions)), the structural weights are drawn with extra-thick lines in the Amos Graphics window.
###### Structural intercepts
*Help context ID: 11013*
Structural intercepts are intercepts in the equations for predicting variables in the structural part of the model. For models that have no structural intercepts, the **Structural intercepts** caption is disabled.
Click the **Structural intercepts** caption to display in color the endogenous variables in the structural part of the model. If you have previously selected **Alternative to color** (See [To change accessibility settings](https://ai-docs.amosdevelopment.com/03-amos-graphics-reference-guide-part-2.md#t_tochangeaccessibilityoptions)), the same variables are drawn with extra-thick lines in the Amos Graphics window.
###### Structural means
*Help context ID: 11014*
Structural means are means of exogenous variables in the structural part of the model. For models that have no structural means, the **Structural means** caption is disabled.
Click the **Structural means** caption to display in color the exogenous variables in the structural part of the model. If you have previously selected **Alternative to color** (See [To change accessibility settings](https://ai-docs.amosdevelopment.com/03-amos-graphics-reference-guide-part-2.md#t_tochangeaccessibilityoptions)), the same variables are drawn with extra-thick lines in the Amos Graphics window.
###### Structural covariances
*Help context ID: 11015*
Structural covariances are variances and covariances in the structural part of the model. In a factor analysis model, these are the factor variances and covariances. For models that have no structural covariances, the **Structural covariances** caption is disabled.
Click the **Structural covariances** caption to display in color the exogenous variables in the structural part of the model, and any covariances among them. If you have previously selected **Alternative to color** (See [To change accessibility settings](https://ai-docs.amosdevelopment.com/03-amos-graphics-reference-guide-part-2.md#t_tochangeaccessibilityoptions)), the same variables and covariances are drawn with extra-thick lines in the Amos Graphics window.
###### Structural residuals
*Help context ID: 11016*
Structural residuals are variances and covariances of residual (error) variables in the structural part of the model. If there are no residual variables in the structural part of the model, the **Structural residuals** caption is disabled.
Click the **Structural residuals** caption to display in color the residual variables in the structural part of the model, and any covariances among them. If you have previously selected **Alternative to color** (See [To change accessibility settings](https://ai-docs.amosdevelopment.com/03-amos-graphics-reference-guide-part-2.md#t_tochangeaccessibilityoptions)), the same variables and covariances are drawn with extra-thick lines in the Amos Graphics window.
###### Measurement residuals
*Help context ID: 11017*
Measurement residuals are variances and covariances of residual (error) variables in the measurement part of the model. If there are no residual variables in the measurement part of the model, the **Measurement residuals** caption is disabled.
Click the **Measurement residuals** caption to display in color the residual variables in the measurement part of the model, and any covariances among them. If you have previously selected **Alternative to color** (See [To change accessibility settings](https://ai-docs.amosdevelopment.com/03-amos-graphics-reference-guide-part-2.md#t_tochangeaccessibilityoptions)), the same variables and covariances are drawn with extra-thick lines in the Amos Graphics window.
###### Models
*Help context ID: 11019*
A single set of cross-group parameter constraints is represented by each of the columns numbered 1 through 8.
###### Help
*Help context ID: 11001*
Displays help for this dialog.
###### Default
*Help context ID: 11002*
Restores parameter constraints to their factory defaults.
###### OK
*Help context ID: 11003*
Closes this dialog and performs the specified multiple-group analysis.
###### Cancel
*Help context ID: 11004*
Closes this dialog without performing a multiple-group analysis.
##### Bayesian estimation
*Help context ID: 110*
Menu: **Analyze****®****Bayesian Estimation...**
Shortcut: **Ctrl-B**
This button opens the [ Bayesian SEM Window](#t_ba-frmmain) to perform [Bayesian estimation](#t_7733).
###### Bayesian Estimation
Bayesian estimation combines data together with any prior beliefs or knowledge about model parameters that the analyst may have, to arrive at a posterior distribution that summarizes the updated state of knowledge about the parameters. Bayesian estimation offers a number of benefits to structural equation modelers. Among them are
- Explicit incorporation of any available prior information or beliefs about model parameters
- Good performance in small samples
- Avoidance of inadmissible model parameter values (e.g., negative variances) through the choice of an appropriate prior distribution
- Estimation and hypothesis testing for any user-specified function of the model parameters
Examples 26 through 29 in the *User's Guide* demonstrate Bayesian estimation.
See: [To perform a Bayesian analysis](https://ai-docs.amosdevelopment.com/03-amos-graphics-reference-guide-part-2.md#t_to-perform-a-bayesian-analysis)
###### Bayesian SEM Window
The Bayesian SEM window allows you to carry out a Bayesian analysis and to view the results of the analysis. To get help on a particular element of the window, point to that element with the mouse pointer and press F1.
###### Summary of Posterior Distribution
Each row of this table summarizes the posterior distribution of a single parameter. To update the summary table, click the refresh button $\boldsymbol{\alpha}$. You can choose options for updating the table automatically by clicking **View ****®**** Options ****®**** Refresh**.
Each row of the table describes a single estimand. The columns are labeled as follows.
###### Mean
The estimated posterior mean. It is calculated as $\bar{X}=\frac{1}{N-B}\left(X_{B+1}+X_{B+2}+\cdots+X_{N}\right)$, where *N* is the number of MCMC observations, *B* is the number of burn-in observations and $X_{i}$ is the value of a single estimand on the i-th observation.
###### S.E.
An estimate, SE, of the standard error of $\bar{X}$ obtained by the method of batch means. SE is a measure of the variability in $\bar{X}$ that is attributable to the fact that *N* (the number of MCMC observations) is finite. By default, 20 batches are used to estimate SE. To change the number of batches, click **View ****®**** Options ****®**** MCMC**.
###### S.D.
The estimated standard deviation of the posterior distribution. It is calculated as $\mathrm{SD}=\sqrt{\frac{1}{N-B-1} \sum_{i=B+1}^{N}\left(X_{i}-\bar{X}\right)^{2}}$.
###### C.S.
The Convergence Statistic is computed as $\mathrm{CS}=\frac{\sqrt{\mathrm{SD}^{2}+\mathrm{SE}^{2}}}{\sqrt{\mathrm{SD}^{2}}}=\sqrt{1+\frac{\mathrm{SE}^{2}}{\mathrm{SD}^{2}}}$.
###### Skewness
The estimated skewness of the posterior distribution. It is calculated as the sample skewness of the retained observations, $X_{B+1}, X_{B+2}, \cdots X_{N}$.
###### Kurtosis
The estimated kurtosis of the posterior distribution. It is calculated as the sample kurtosis of the retained observations, $X_{B+1}, X_{B+2}, \cdots X_{N}$.
###### Min
The minimum of the retained observations, $X_{B+1}, X_{B+2}, \cdots X_{N}$.
###### Max
The maximum of the retained observations, $X_{B+1}, X_{B+2}, \cdots X_{N}$.
###### Print
Print the table that summarizes the posterior distribution of the parameters.
###### Print Preview
Display the table that summarizes the posterior distribution of the parameters, as it will be printed if you click the [Print](#t_ba-tb-print) button.
###### Print Setup
Select a printer, as well as paper size, duplex printing, number of copies, and so forth.
###### Options
Choose options that affect the MCMC algorithm and the display of results.
###### Copy
Copy to the clipboard the table that summarizes the posterior distribution of the parameters.
###### Refresh
Refresh the displayed results. You can schedule automatic updates of the displayed results on the **Refresh** tab of the Bayesian SEM **Options** window.
###### Prior
Display and optionally modify the prior distribution of parameters.
###### Posterior
Open a window that plots the marginal posterior distribution of the parameter that is selected in the summary table. If you hold down the control key and select two parameters (i.e., two rows) in the summary table, you will get a plot of their marginal bivariate distribution.
###### Posterior Predictive
Open the [Posterior Predictive Distributions Window](https://ai-docs.amosdevelopment.com/03-amos-graphics-reference-guide-part-2.md#t_imp-pickvariables-frmpickvariables).
###### Fit Measures
Open the Bayesian [Fit Measures Window](https://ai-docs.amosdevelopment.com/03-amos-graphics-reference-guide-part-2.md#t_ba-fit-frmfitsummary).
###### Additional estimands
Display estimates of other quantities besides model parameters. You can perform Bayesian estimation for the following quantities.
- Implied means, covariances and correlations (for the observed variables only)
- All implied means, covariances and correlations (for all variables in the model except residual variables)
- Direct, indirect and total effects
- Standardized direct, indirect and total effects
- Factor score weights
To perform Bayesian estimation for these quantities, you must specify that you want to estimate them in Amos Graphics, before opening the Bayesian SEM window. (Click **View****®****Analysis Properties****®****Output**, and put a check mark next to those quantities that you want to estimate.)
###### Increase decimal places
Show one additional digit after the decimal point. This button affects all of the following windows.
- [Bayesian SEM Window](#t_ba-frmmain)
- [Additional Estimands Window](#t_ba-de-frmderived)
- [Custom Estimands Window](#t_ba-ce-frmcustomestimands)
###### Decrease decimal places
Show one less digit after the decimal point. This button affects all of the following windows.
- [Bayesian SEM Window](#t_ba-frmmain)
- [Additional Estimands Window](#t_ba-de-frmderived)
- [Custom Estimands Window](#t_ba-ce-frmcustomestimands)
###### About
Display version and copyright information for this program.
###### Help contents
Display the help contents page.
###### Custom estimands
Open a window that allows you to write a VB.NET or C# program for computing new estimands for which Amos will estimate the posterior distribution. The new estimands that you define with your VB.NET or C# program can be any function of the model parameters.
###### Adapt
The **Adapt** button automatically adjusts the parameters of the MCMC algorithm in an effort to increase the rate of convergence. Each time you press the **Adapt** button, information contained in the MCMC sample already collected is used to adjust the parameters of the MCMC algorithm. Then the MCMC sample already collected is discarded, and sampling starts all over again.
The **Adapt** button is disabled when the parameters of the MCMC algorithm do not need adjusting, and also when too few MCMC samples have been collected to allow choosing new parameters.
For the random walk Metropolis algorithm, the **Adapt** button adjusts the [tuning parameter](https://ai-docs.amosdevelopment.com/03-amos-graphics-reference-guide-part-2.md#t_ba-op-label10) in order to achieve a satisfactory [acceptance rate](#t_ba-tb-labelacceptancerate). At the time of this writing, the target range for the acceptance rate is between 0.2 and 0.4.
For Hamiltonian MCMC, the **Adapt** button adjusts the leapfrog step size and the number of leapfrog steps in order to achieve a satisfactory [acceptance rate](#t_ba-tb-labelacceptancerate). At the time of this writing, the target range for the acceptance rate is between 0.98 and 0.998.
###### Convergence Statistic
The global convergence statistic. The convergence statistic is a measure of the accuracy of the observed distribution of sampled parameter values as an estimate of the parameters' posterior distribution. Smaller values of the convergence statistic are better. See [Convergence Statistic Definition](https://ai-docs.amosdevelopment.com/03-amos-graphics-reference-guide-part-2.md#t_7589).
A happy  or unhappy  face indicates whether the global convergence statistic satisfies the convergence criterion. By default, the convergence criterion is 1.002. That is, the convergence statistic must fall below 1.002 to get a happy face. You can change the convergence criterion on the MCMC tab of the Bayesian SEM [Options](#t_ba-op-frmoptions) window.
###### Pause sampling
Click this button to stop sampling. Click it again to permit sampling to continue.
###### Reset
Discard all accumulated samples and then continue sampling.
###### Sample size
The number of burn-in observations and the number of post-burn-in observations generated so far.
For example, "500+27,000", means that there have been a total of 27,500 observations consisting of 500 burn-in observations and 27,000 post-burn-in observations.
An "\*" character means that thinning of the samples has occurred. For example, "(500+27000)\*8" means that the sample has been thinned three times so that only one out of eight observations remains. There have been a total of 220,000 observations, of which only 27,500 remain. Of those 27,500, 500 were treated as burn-in observations.
###### Sample size at last refresh
The number of burn-in observations and the number of post-burn-in observations at the time of the most recent refresh of the displayed results. (Displayed results are not refreshed every time the MCMC algorithm generates a new observation. By default, the display is refreshed every 1000-th observation. You can change the default on the **Refresh** tab of the Bayesian SEM [Options](#t_ba-op-frmoptions) window.)
For example, "500+27,000", means that there were a total of 27,500 observations consisting of 500 burn-in observations and 27,000 post-burn-in observations at the time of the most recent refresh of the displayed results.
An "\*" character means that thinning of the samples had occurred when the display was refreshed. For example, "(500+27000)\*8" means that the sample had been thinned three times so that only one out of eight observations remained. There were a total of 220,000 observations, of which only 27,500 remained. Of those 27,500, 500 were treated as burn-in observations.
###### Observations per Second
The number of observations generated by the MCMC algorithm per second.
###### Acceptance Rate
The acceptance rate is the proportion of times the Metropolis sampling algorithm generates a sample of parameter values that differs from the previous sample. For example, an acceptance rate of .2 means that, in generating a sequence of parameter values, the algorithm generates new parameter values 20% of the time and repeats the previous parameter values 80% of the time.
One rule of thumb is that MCMC algorithm is most effective when the acceptance rate is between .2 and .5. If you see that the acceptance rate is outside this range, it may be worthwhile to try adjusting the tuning parameter. If the acceptance rate is less than .2, try making the tuning parameter smaller. If the acceptance rate is greater than .5, try making the tuning parameter larger.
See [How the MCMC algorithm works](https://ai-docs.amosdevelopment.com/03-amos-graphics-reference-guide-part-2.md#t_7653).
###### Exit
Close the Bayesian SEM window.
###### Export Posterior
Create a file that contains the sampled parameter values.
The file is in text format with a column for each model parameter and a row for each MCMC observation. The first row contains column labels. The file includes the burn-in observations, but not the pre-burn-in observations (see [How the MCMC algorithm works](https://ai-docs.amosdevelopment.com/03-amos-graphics-reference-guide-part-2.md#t_7653)).
###### Custom Estimands Window
This window summarizes the marginal posterior distribution of estimands that you previously defined by clicking the **Custom estimands** button  in the [Bayesian SEM](#t_ba-frmmain) window and writing a VB.NET or C# program to calculate the estimands as functions of the model parameters.
The **Custom Estimands** window is not automatically refreshed when the [Bayesian SEM](#t_ba-frmmain) window is refreshed. The **Custom Estimands** window has its own **Refresh** button $\boldsymbol{\alpha}$.
See Example 29 in the User's Guide.
###### Numeric Estimands
This portion of the **Custom Estimands** window summarizes the marginal posterior distribution of any numeric estimands that you previously defined by clicking the **Custom estimands** button  in the [Bayesian SEM](#t_ba-frmmain) window and writing a VB.NET or C# program to calculate the estimands as functions of the model parameters.
The columns of the summary table are labeled in the same way as the columns of the summary table in the [Bayesian SEM](#t_ba-frmmain) window. (See [Summary of Posterior Distribution](#t_ba-grid1).)
The **Custom Estimands** window is not automatically refreshed when the [Bayesian SEM](#t_ba-frmmain) window is refreshed. The **Custom Estimands** window has its own **Refresh** button $\boldsymbol{\alpha}$.
See Example 29 in the User's Guide.
###### Dichotomous Estimands
This portion of the **Custom Estimands** window summarizes the marginal posterior distribution of any dichotomous estimands that you previously defined by clicking the **Custom estimands** button  in the [Bayesian SEM](#t_ba-frmmain) window and writing a VB.NET or C# program to calculate the estimands as functions of the model parameters.
The P column shows the proportion of times that each dichotomous estimand was "true" in the whole series of MCMC samples. The P1, P2, and P3 columns show the proportion of times each logical expression was true in the first third, the middle third, and the final third of the MCMC samples.
The **Custom Estimands** window is not automatically refreshed when the [Bayesian SEM](#t_ba-frmmain) window is refreshed. The **Custom Estimands** window has its own **Refresh** button $\boldsymbol{\alpha}$.
See Example 29 in the User's Guide.
###### Print
Print the tables in the **Custom Estimands** window.
###### Print Preview
Display the tables in the **Custom Estimands** window as they will be printed if you click .
###### Print Setup
Select a printer, as well as paper size, duplex printing, number of copies, and so forth.
###### Copy
Copy the selected table to the clipboard. In the following figure, the Numeric Estimands table will be copied to the clipboard because the selected row (the **indirect** row) is in the Numeric Estimands table. To copy the Dichotomous Estimands table to the clipboard, first click a row of the Dichotomous Estimands table in order to select that row.

The table will be copied to the clipboard as tab-delimited text.
###### Refresh
Update the **Custom Estimands** window using all MCMC observations accumulated so far. The Custom Estimands window is not updated automatically because updating this window can take a lot of time. The Custom Estimands window is updated only when you click $\boldsymbol{\alpha}$ in the Custom Estimands window.
###### Posterior
Open a window that plots the marginal posterior distribution of the estimand that is selected in the **Custom Estimands** window. If you hold down the control key and select two estimands, you will get a plot of their marginal bivariate distribution.
###### Increase decimal places
Show one additional digit after the decimal point. This button affects all of the following windows.
- [Bayesian SEM Window](#t_ba-frmmain)
- [Additional Estimands Window](#t_ba-de-frmderived)
- [Custom Estimands Window](#t_ba-ce-frmcustomestimands)
###### Decrease decimal places
Show one less digit after the decimal point. This button affects all of the following windows.
- [Bayesian SEM Window](#t_ba-frmmain)
- [Additional Estimands Window](#t_ba-de-frmderived)
- [Custom Estimands Window](#t_ba-ce-frmcustomestimands)
###### About
Display version and copyright information for this program.
###### Help contents
Display the help contents page.
###### Additional Estimands Window
The **Additional Estimands** window displays estimates of various quantities other than model parameters.

###### Groups
Select the group for which you want to display results. You can select only one group at a time. In the example below, results are displayed for girls.
Put a check mark next to each group for which you want to print results when you click . You can put a check mark next to as many groups as you want, but you must put a check mark next to at least one group in order to get any printed output. In the example below, results will be printed for girls and for boys when you click .

###### Available estimands
Select the estimand for which you want to display results. You can select only one estimand at a time. In the example below, results are displayed for standardized indirect effects.
Put a check mark next to each estimand for which you want to print results when you click . You can put a check mark next to as many estimands as you want, but you must put a check mark next to at least one estimand in order to get any printed output. In the example below, results will be printed for standardized direct effects, for standardized indirect effects, and for standardized total effects when you click .

###### Available summary statistics
Select the summary statistic that you want to display as a descriptor of the marginal posterior distribution of the estimand that you selected. For example, select **Mean** if you want to display the posterior mean for each estimand.You can select only one summary statistic at a time. In the example below, posterior means are displayed for standardized indirect effects.
Put a check mark next to each summary statistic for which you want to print results when you click . You can put a check mark next to as many summary statistics as you want, but you must put a check mark next to at least one summary statistic in order to get any printed output. In the example below, the posterior median, and the upper and lower bounds of a 50% credible interval will be printed when you click .

###### Table of summary statistics
The table of summary statistics displays some descriptor of the marginal posterior distribution of the estimand that you selected in the panel at the left side of the window. In the figure below, posterior means are displayed for standardized indirect effects in the group **girls**.
To view a plot of an estimand's posterior, right-click the estimand and select **Show Posterior** from the menu that pops up, as shown below.

###### Print
Print the items that have check marks in the **Additional Estimands** window. In the figure below,
- two groups (girls and boys) have check marks.
- three estimands (standardized direct effects, standardized indirect effects and standardized total effects) have check marks.
- three summary statistics (median, 50% lower bound and 50% upper bound) have check marks.
When  is clicked, 2\*3\*3=18 tables will be printed.

###### Print Preview
Display the items that have check marks in the **Additional Estimands** window as they will be printed if you click .
###### Print Setup
Select a printer, as well as paper size, duplex printing, number of copies, and so forth.
###### Copy
Copy the displayed table to the clipboard. The table will be copied as tab-delimited text. Table entries will be separated by tabs.
###### Refresh
Update the **Additional Estimands** window using all MCMC observations accumulated so far. The Additional Estimands window is not updated automatically because updating this window can take a lot of time. The Additional Estimands window is updated only when you click $\boldsymbol{\alpha}$ in the Additional Estimands window.
###### Posterior
 opens a window that plots the posterior distribution of estimands that are selected in the table of the **Additional Estimands** window.
Click  before selecting the estimands whose posterior you want to plot. If you hold down the control key and select two estimands, you will get a plot of their marginal bivariate distribution.
In the following figure, the posterior distribution of the indirect effect of ses on anomia71 will be plotted.

###### Increase decimal places
Show one additional digit after the decimal point. This button affects all of the following windows.
- [Bayesian SEM Window](#t_ba-frmmain)
- [Additional Estimands Window](#t_ba-de-frmderived)
- [Custom Estimands Window](#t_ba-ce-frmcustomestimands)
###### Decrease decimal places
Show one less digit after the decimal point. This button affects all of the following windows.
- [Bayesian SEM Window](#t_ba-frmmain)
- [Additional Estimands Window](#t_ba-de-frmderived)
- [Custom Estimands Window](#t_ba-ce-frmcustomestimands)
###### About
Display version and copyright information for this program.
###### Help contents
Display the help contents page.
###### Bayesian Options Window
Use the **Options** window to specify options that affect the MCMC algorithm and the display of results.
###### The Display Tab
Use the **Display** tab to select the summary statistics you want to display in the summary table to summarize the marginal posterior distribution of each parameter. The selections you make on the Display tab also affect the summaries that appear in the [Additional Estimands](#t_ba-de-frmderived) window and in the [Custom Estimands](#t_ba-ce-frmcustomestimands) window.
###### Mean
Put a check mark here to display the mean of each estimand's posterior distribution.
###### Standard error
Put a check mark here to display an estimate of the [MCMC standard error](https://ai-docs.amosdevelopment.com/03-amos-graphics-reference-guide-part-2.md#t_imp-post-labelse) each estimand's posterior mean.
###### Standard deviation
Put a check mark here to display the standard deviation of each estimand's posterior distribution.
###### Convergence statistic
Put a check mark here to display the [convergence statistic](https://ai-docs.amosdevelopment.com/03-amos-graphics-reference-guide-part-2.md#t_7589) for each estimand.
###### Median
Put a check mark here to display the median of each estimand's posterior distribution.
###### Credible interval
Put a check mark here to display a credible interval for each estimand. A credible interval is sometimes called a Bayesian confidence interval. By default, 50% credible intervals are displayed. That is, there is a .50 probability that the credible interval displayed for an estimand contains the value of the estimand. You can specify a "confidence level" other than 50% by changing the [Confidence level](#t_ba-op-labelconfidencelevel) value.
###### Skewness
Put a check mark here to display the skewness of each estimand's posterior distribution.
###### Kurtosis
Put a check mark here to display the kurtosis of each estimand's posterior distribution.
###### Minimum & maximum
Put a check mark here to display the smallest and the largest sampled value for each estimand.
###### Parameter name
Put a check mark here to display each model parameter's name along with the summary of its posterior distribution.
Parameter names referred to here are names that you assign to parameters when you specify a model. In Amos Graphics, parameter names are assigned to parameters through use of the [Object Properties](#t_viewobjectproperties) dialog.
###### Confidence level
The value that you enter here is interpreted as a percentage. It is the "confidence level" used in determining credible intervals, or "Bayesian confidence intervals". For example, if you enter "90", then 90% credible intervals will be displayed. That is, the credible interval displayed for an estimand will contain the value of the estimand with probability .90.
###### The Refresh Tab
Use the **Refresh** tab to specify how often you want the summary table in the [Bayesian SEM](#t_ba-frmmain) window to be updated. Updating the display too often can slow the MCMC algorithm down.
The choices you make on the Refresh tab do not affect the updating of the [Additional Estimands](#t_ba-de-frmderived) window or the [Custom Estimands](#t_ba-ce-frmcustomestimands) window. Each of those windows has its own refresh button $\boldsymbol{\alpha}$ that can be clicked to update the window.
###### Refresh the display manually
Do not automatically [refresh](#t_ba-op-optionsnapshotrule_manual) the table that summarizes the posterior distribution of the model parameters. Refresh the summary table only when the refresh $\boldsymbol{\alpha}$ button is clicked. The refresh button updates the table that summarizes the posterior distribution of the parameters and the graphical display of the posterior, so that they reflect all the samples that have been retained so far.
###### Refresh the display every ____ observations
The summary table in the [Bayesian SEM](#t_ba-frmmain) window will be updated whenever the number of MCMC observations is a multiple of the value specified here. For example, if you specify "1000" then the summary table will be updated when the number of observations reaches 1000, then again when it reaches 2000, and so on.
This setting affects the updating of the [Bayesian SEM](#t_ba-frmmain) window, but not other windows. The posterior summaries for Additional Estimands can only be updated by clicking $\boldsymbol{\alpha}$ in the [Additional Estimands](#t_ba-de-frmderived) window. The same goes for posterior summaries in the [Custom Estimands](#t_ba-ce-frmcustomestimands) window.
###### Refresh the display every _____ seconds
The table that summarizes the posterior distribution of model parameters will be updated whenever the elapsed time (in seconds) is a multiple of the value specified here. For example, if you specify "30" then the summary table will be updated every 30 seconds.
This setting affects the updating of the [Bayesian SEM](#t_ba-frmmain) window, but not other windows. The posterior summaries for Additional Estimands can only be updated by clicking $\boldsymbol{\alpha}$ in the [Additional Estimands](#t_ba-de-frmderived) window. The same goes for posterior summaries in the [Custom Estimands](#t_ba-ce-frmcustomestimands) window.